Vtune 学习笔记 分析锁 Tutorial: Analyzing Locks and Waits
来源:互联网 发布:淘宝助手批量上传 编辑:程序博客网 时间:2024/06/06 11:01
This tutorial shows how to use the Locks and Waits analysis of the Intel® VTune™ Amplifier XE to identify one of the most common reasons for an inefficient parallel application - threads waiting too long on synchronization objects (locks) while processor cores are underutilized. Focus your tuning efforts on objects with long waits where the system is underutilized.
Estimated completion time: 15 minutes.
Sample application: tachyon.
After you complete this tutorial, you should be able to:
- Choose an analysis target.
- Choose the Locks and Waits analysis type.
- Run the Locks and Waits analysis.
- Identify the synchronization objects with long waits and poor CPU utilization.
- Analyze the source code to locate the most critical code lines.
- Compare results before and after optimization.
Workflow Steps to Identify Locks and Waits
![]()
You can use the Intel® VTune™ Amplifier XE to understand the cause of the ineffective processor utilization by performing a series of steps in a workflow. This tutorial guides you through these workflow steps while using a sample ray-tracer application named tachyon.
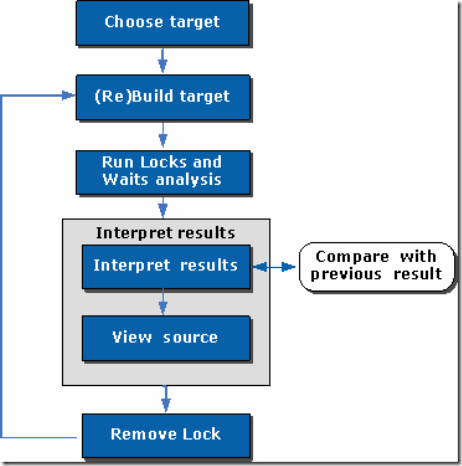
- Choose a target to analyze for locks and waits.
- Configure environment and project settings and build the target.
- Run the Locks and Waits analysis.
- Interpret the result data.
- View and analyze code of the performance-critical function.
- Modify the code to remove the lock.
- Re-build the target, re-run the Locks and Waits analysis, and compare the result data before and after optimization.
跟 上一次 hotpot有 异曲同工的 图。
。。。
。。。

。。。
Interpret Result Data
![]()
When the sample application exits, the Intel® VTune™ Amplifier XE finalizes the results and opens the Locks and Waits viewpoint that consists of the Summary window, Bottom-up pane, Top-down Tree pane, Call Stack pane, and Timeline pane. To interpret the data on the sample code performance, do the following:
- Analyze the basic performance metrics provided by the Locks and Waits analysis.
- Identify locks.
![]()
NOTE
The screenshots and execution time data provided in this tutorial are created on a system with four CPU cores. Your data may vary depending on the number and type of CPU cores on your system.
Analyze the Basic Locks and Waits Metrics
Start with exploring the data provided in the Summary window for the whole application performance. To interpret the data, hover over the question mark icons
![]()
to read the pop-up help and better understand what each performance metric means.
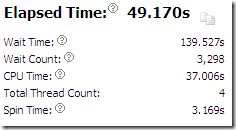
The Result Summary section provides data on the overall application performance per the following metrics: 1) Elapsed Time is the total time for each core when it was either waiting or not utilized by the application; 2)Total Thread Count is the number of threads in the application;
3)Wait Time is the amount of time the application threads waited for some event to occur, such as synchronization waits and I/O waits;
4) Wait Count is the overall number of times the system wait API was called for the analyzed application;
5) CPU Time is the sum of CPU time for all threads;
6) Spin Time is the time a thread is active in a synchronization construct.
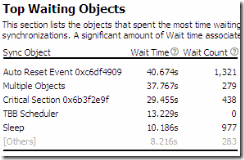
For the tachyon_analyze_locks application, the Wait time is high. To identify the cause, you need to understand how this Wait time was distributed per synchronization objects.
The Top Waiting Objects section provides the list of five synchronization objects with the highest Wait Time and Wait Count, sorted by the Wait Time metric.
For the tachyon_analyze_locksapplication, focus on the first three objects and explore the Bottom-up pane data for more details.
The Thread Concurrency Histogramrepresents the Elapsed time and concurrency level for the specified number of running threads. Ideally, the highest bar of your chart should be within the Ok or Ideal utilization range.

Note the Target value. By default, this number is equal to the number of physical cores. Consider this number as your optimization goal.
The Average metric is calculated as CPU time / Elapsed time. Use this number as a baseline for your performance measurements. The closer this number to the number of cores, the better.
For the sample code, the chart shows that tachyon_analyze_locks is a multithreaded application running four threads on a machine with four cores. But it is not using available cores effectively. The Average CPU Usage on the chart is about 0.7 while your target should be making it as closer to 4 as possible (for the system with four cores).
Hover over the second bar to understand how long the application ran serially. The tooltip shows that the application ran one thread for almost 15 seconds, which is classified as Poor concurrency.
The CPU Usage Histogramrepresents the Elapsed time and usage level for the logical CPUs. Ideally, the highest bar of your chart should be within the Ok or Ideal utilization range.
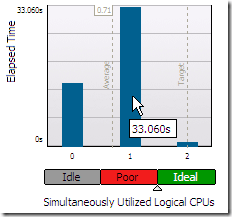
The tachyon_analyze_locksapplication ran mostly on one logical CPU. If you hover over the second bar, you see that it spent 16.603 seconds using one core only, which is classified by the VTune Amplifier XE as a Poor utilization. To understand what prevented the application from using all available logical CPUs effectively, explore the Bottom-up pane.
Identify Locks
Click the Bottom-up tab to open the Bottom-up pane.
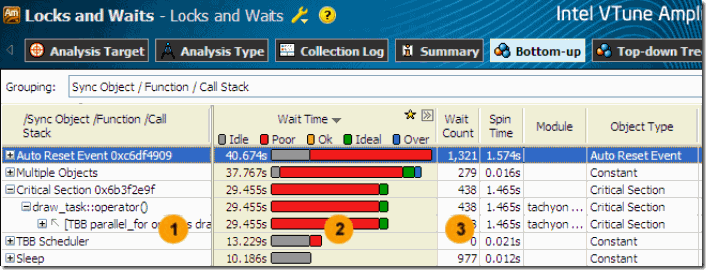
![]()
Synchronization objects that control threads in the application. The hash (unique number) appended to some names of the objects identify the stack creating this synchronization object.
For Intel® Threading Building Blocks (Intel® TBB), VTune Amplifier XE is able to recognize all types of Intel TBB objects. To display an overhead introduced by Intel TBB library internals, the VTune Amplifier XE creates a pseudo synchronization object TBB scheduler that includes all waits from the Intel TBB runtime libraries.
![]()
The utilization of the processor time when a given thread waited for some event to occur. By default, the synchronization objects are sorted by Poor processor utilization type. Bars showing OK or Ideal utilization (orange and green) areutilizing the processors well. You should focus your optimization efforts on functions with the longest poor CPU utilization (red
![]()
bars if the bar format is selected). Next, search for the longest over-utilized time (blue
![]()
bars).
This is the Data of Interest column for the Locks and Waits analysis results that is used for different types of calculations, for example: call stack contribution, percentage value on the filter toolbar.
66:关键点
![]()
Number of times the corresponding system wait API was called. For a lock, it is the number of times the lock was contended and caused a wait. Usually you are recommended to focus your tuning efforts on the waits with both high Wait Time and Wait Count values, especially if they have poor utilization.
![]()
Wait time, during which the CPU is busy. This often occurs when a synchronization API causes the CPU to poll while the software thread is waiting. Some Spin time may be preferable to the alternative of the increased thread context switches. However, too much Spin time can reflect lost opportunity for productive work.
For the analyzed sample code, you see that the top three synchronization objects caused the longest Wait time. The red bars in the Wait Timecolumn indicate that most of the time for these objects processor cores were underutilized.
From the code knowledge, you may understand that the Manual and Auto Reset Event objects are most likely related to the join where the main program is waiting for the worker threads to finish. This should not be a problem. Consider the third item in the Bottom-up pane that is more interesting. It is a Critical Section that shows much serial time and is causing a wait. Click the plus sign
![]()
at the object name to expand the node and see the draw_task wait function that contains this critical section and call stack. Double-click the Critical Section to see the source code for the wait function.
Recap
You identified a synchronization object with the high Wait Time and Wait Count values and poor CPU utilization that could be a lock affecting application parallelism. Your next step is to analyze the code of this function.
Analyze Code
![]()
You identified the critical section that caused significant Wait time and poor processor utilization. Double-click this critical section in the Bottom-up pane to view the source. The Intel® VTune™ Amplifier XE opens source and disassembly code. Focus on the Source pane and analyze the source code:
- Understand basic options provided in the Source window.
- Identify the hottest code lines.
Understand Basic Source View Options
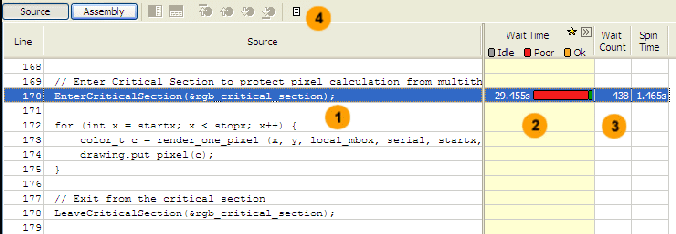
The table below explains some of the features available in the Source panefor the Locks and Waits viewpoint.
![]()
Source code of the application displayed if the function symbol information is available. When you go to the source by double-clicking the synchronization object in the Bottom-up pane, the VTune Amplifier XE opens the wait function containing this object and highlights the code line that took the most Wait time. The source code in the Source pane is not editable.
If the function symbol information is not available, the Assembly pane opens displaying assembler instructions for the selected wait function. To view the source code in the Source pane, make sure to build the target properly.
![]()
Processor time and utilization bar attributed to a particular code line. The colored bar represents the distribution of the Wait time according to the utilization levels (Idle, Poor, Ok, Ideal, and Over) defined by the VTune Amplifier XE. The longer the bar, the higher the value. Ok utilization level is not available for systems with a small number of cores.
This is the Data of Interest column for the Locks and Waits analysis.
![]()
Number of times the corresponding system wait API was called while this code line was executing. For a lock, it is the number of times the lock was contended and caused a wait.
![]()
Source window toolbar. Use hotspot navigation buttons to switch between most performance-critical code lines. Hotspot navigation is based on the metric column selected as a Data of Interest. For the Locks and Waits analysis, this is Wait Time. Use the source file editor button to open and edit your code in your default editor.
Identify the Hottest Code Lines
The VTune Amplifier XE highlights line 170 entering the critical section rgb_critical_section in the draw_task function. The draw_task function was waiting for almost 27 seconds while this code line was executing and most of the time the processor was underutilized. During this time, the critical section was contended 438 times.
The rgb_critical section is the place where the application is serializing. Each thread has to wait for the critical section to be available before it can proceed. Only one thread can be in the critical section at a time. You need to optimize the code to make it more concurrent. Click the
![]()
Source Editor button on the Source window toolbar to open the code editor and optimize the code.
Remove Lock
![]()
In the Source window, you located the critical section that caused a significant wait while the processor cores were underutilized and generated multiple wait count. Focus on this line and do the following:
- Open the code editor.
- Modify the code to remove the lock.
Open the Code Editor
Click the
![]()
Source Editor button to open the analyze_locks.cpp file in your default editor at the hotspot code line:
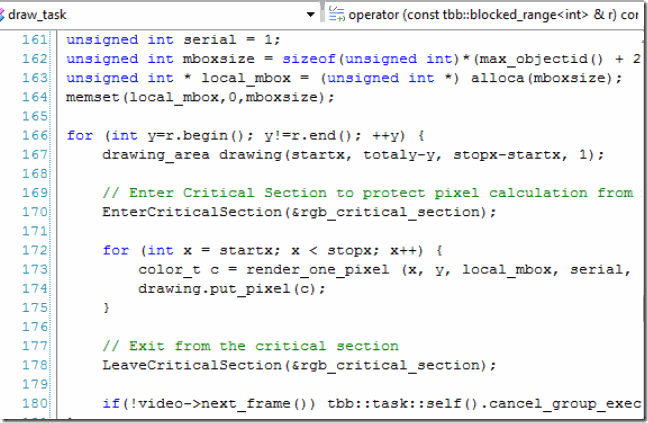
Remove the Lock
The rgb_critical_section was introduced to protect calculation from multithreaded access. The brief analysis shows that the code is thread safe and the critical section is not really needed.
Compare with Previous Result
![]()
You made sure that removing the critical section gave you 13 seconds of optimization in the application execution time. To understand the impact of your changes and how the CPU utilization has changed, re-run the Locks and Waits analysis on the optimized code and compare results:
- Compare results before and after optimization.
- Identify the performance gain.
Compare Results Before and After Optimization
- Run the Locks and Waits analysis on the modified code.
- Click the Compare Results button on the Intel® VTune™ Amplifier XE toolbar.
The Compare Results window opens. - Specify the Locks and Waits analysis results you want to compare:
The Summary window opens providing the statistics for the difference between collected results.
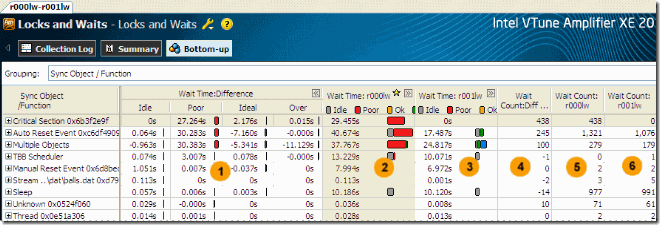
Click the Bottom-up tab to see the list of synchronization objects used in the code, Wait time utilization across the two results, and the differences side by side:
![]()
Difference in Wait time per utilization level between the two results in the following format: <Difference Wait Time> = <Result 1 Wait Time> – <Result 2 Wait Time>. By default, the Difference column is expanded to display comparison data per utilization level. You may collapse the column to see the total difference data per Wait time.
![]()
Wait time and CPU utilization for the initial version of the code.
![]()
Wait time and CPU utilization for the optimized version of the code.
![]()
Difference in Wait count between the two results in the following format: <Difference Wait Count> = <Results 1 Wait Count> - <Result 2 Wait Count>.
![]()
Wait count for the initial version of the code.
![]()
Wait count for the optimized version of the code.
I
dentify the Performance Gain
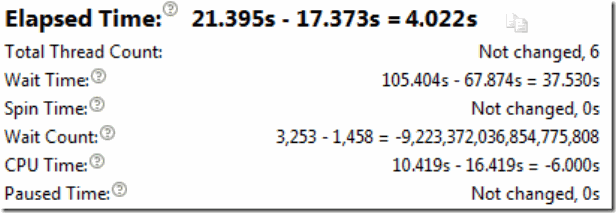
The Elapsed time data in the Summary window shows the optimization of 4 seconds for the whole application execution and Wait time decreased by 37.5 seconds.
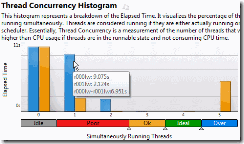
According to the Thread Concurrency histogram, before optimization (blue bar) the application ran serially for 9 seconds poorly utilizing available processor cores but after optimization (orange bar) it ran serially only for 2 seconds. After optimization the application ran 5 threads simultaneously overutilizing the cores for almost 5 seconds. Further, you may consider this direction as an additional area for improvement.
In the Bottom-up pane, locate the Critical Section you identified as a bottleneck in your code. Since you removed it during optimization, the optimized result r001lw does not show any performance data for this synchronization object. If you collapse the Wait
Time:Difference column by clicking the
![]()
button, you see that with the optimized result you got almost 29 seconds of optimization in Wait time.

Recap
You ran the Locks and Waits analysis on the optimized code and compared the results before and after optimization using the Compare mode of the VTune Amplifier XE. The comparison shows that, with the optimized version of the tachyon_analyze_locks application (r001lw result), you managed to remove the lock preventing application parallelism and significantly reduce the application execution time. Compare analysis results regularly to look for regressions and to track how incremental changes to the code affect its performance. You may also want to use the VTune Amplifier XE command-line interface and run the amplxe-cl command to test your code for regressions. For more details, see the Command-line Interface Support section in the VTune Amplifier XE online help.
- Vtune 学习笔记 分析锁 Tutorial: Analyzing Locks and Waits
- Oracle8i Internal Services for Waits, Latches, Locks, and Memory
- VTune tutorial
- python tutorial 学习笔记(七)Errors and Exceptions
- Windows and Window Controllers in OS X Tutorial学习笔记
- Python Tutorial 学习笔记6 --Errors and Exceptions
- An ffmpeg and SDL Tutorial 学习笔记(一)
- An ffmpeg and SDL Tutorial 学习笔记(二)
- An ffmpeg and SDL Tutorial 学习笔记(三)
- An ffmpeg and SDL Tutorial 学习笔记(四)
- An ffmpeg and SDL Tutorial 学习笔记(五)
- An ffmpeg and SDL Tutorial 学习笔记(六)
- An ffmpeg and SDL Tutorial 学习笔记(七)
- Analyzing Display and Performance
- Vtune动态分析
- vtune使用笔记
- vtune使用笔记
- JNDI tutorial学习笔记
- jsp中进行翻页跳转
- 大魔术师
- HTML5移动开发(9)——从一个多媒体标签说起
- ios UIScrollView 一些属性
- [Android]Tab
- Vtune 学习笔记 分析锁 Tutorial: Analyzing Locks and Waits
- 图像显著性论文(四)—Context-Aware Saliency Detection
- 图解classloader加载class的流程及自定义ClassLoader
- 1
- java反射
- 第8周项目4-个人所得税计算器
- nyist 509 因子和阶乘
- ios 百度推送获取不到deviceToken原因
- 友好城市


