A closer look at Android ART in AndroidL
来源:互联网 发布:spyder python 重装 编辑:程序博客网 时间:2024/05/22 00:44
A Closer Look at Android RunTime (ART) in Android L
From: http://www.anandtech.com/print/8231/a-closer-look-at-android-runtime-art-in-android-l
- Posted in
- Smartphones
- Tablets
- Android L
- ART
- Laptops
- Mobile
With the latest I/O conference, Google has finally publicly announced its plans for its new runtime on Android. The Android RunTime, ART, is the successor and replacement for Dalvik, the virtual machine on which Android Java code is executed on. We’ve had traces and previews of it available with KitKat devices since last fall, but there wasn’t much information in terms of technical details and the direction Google was heading with it.
Contrary to other mobile platforms such as iOS, Windows or Tizen, which run software compiled natively to their specific hardware architecture, the majority of Android software is based around a generic code language which is transformed from “byte-code” into native instructions for the hardware on the device itself.
Over the years and from the earliest Android versions, Dalvik started as a simple VM with little complexity. With time, however, Google felt the need to address performance concerns and to be able to keep up with hardware advances of the industry. Google eventually added a JIT-compiler to Dalvik with Android’s 2.2 release, added multi-threading capabilities, and generally tried to improve piece by piece.
However, lately over the last few years the ecosystem had been outpacing Dalvik development, so Google sought to build something new to serve as a solid foundation for the future, where it could scale with the performance of today’s and the future’s 8-core devices, large storage capabilities, and large working memories.
Thus ART was born.
Architecture
First, ART is designed to be fully compatible with Dalvik’s existing byte-code format, “dex” (Dalvik executable). As such, from a developer’s perspective, there are no changes at all in terms of having to write applications for one or the other runtime and no need to worry about compatibilities.
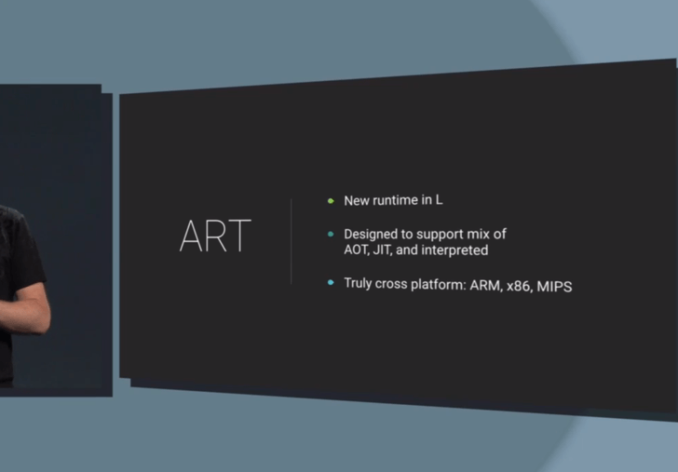
The big paradigm-shift that ART brings, is that instead of being a Just-in-Time (JIT) compiler, it now compiles application code Ahead-of-Time (AOT). The runtime goes from having to compile from bytecode to native code each time you run an application, to having it to do it only once, and any subsequent execution from that point forward is done from the existing compiled native code.
Of course, these native translations of the applications take up space, and this new methodology is something that has been made possible today only due to the vast increases in available storage space on today’s devices, a big shift from the early beginnings of Android devices.
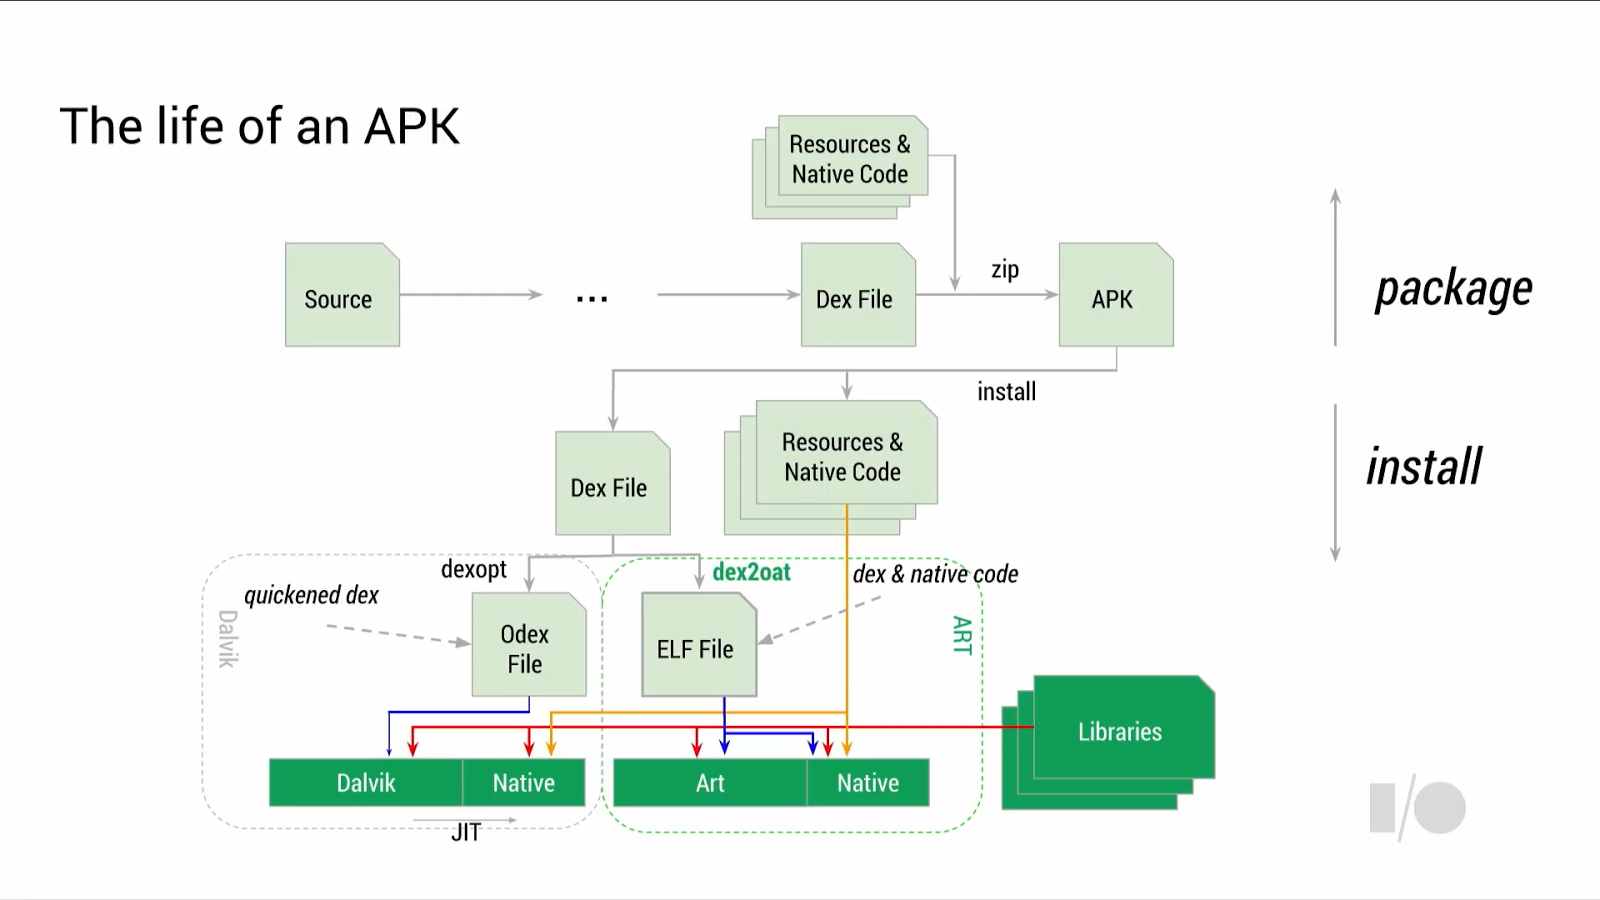
This shift opens up a large amount of optimizations which were not possible in the past; because code is optimized and compiled only once, it is worth to optimize it really well that one time. Google claims that it now is able to achieve higher level optimizations over the whole of an applications code-base, as the compiler has an overview of the totality of the code, as opposed to the current JIT compiler which only does optimizations in local/method chunks. Overhead such as exception checks in code are largely removed, and method and interface calls are vastly sped up. The process which does this is the new “dex2oat” component, replacing the “dexopt” Dalvik equivalent. Odex files (optimized dex) also disappear in ART, replaced by ELF files.
Because ART compiles an ELF executable, the kernel is now able to handle page handling of code pages - this results in possibly much better memory management, and less memory usage too. I’m curious what the effect of KSM (Kernel same-page merging) has on ART, it’s definitely something to keep an eye on.
The implications to battery life are also significant - since there is no more interpretation or JIT-work to be done during the runtime of an app, that results in direct savings of CPU cycles, and thus, power consumption.
The only downside to all of this, is that this one-time compilation takes more time to complete. A device’s first boot, and an application’s first start-up will be much increased compared to an equivalent Dalvik system. Google claims that this is not too dramatic, as they expect the finished shipping runtime to be equivalent or even faster than Dalvik in these aspects.
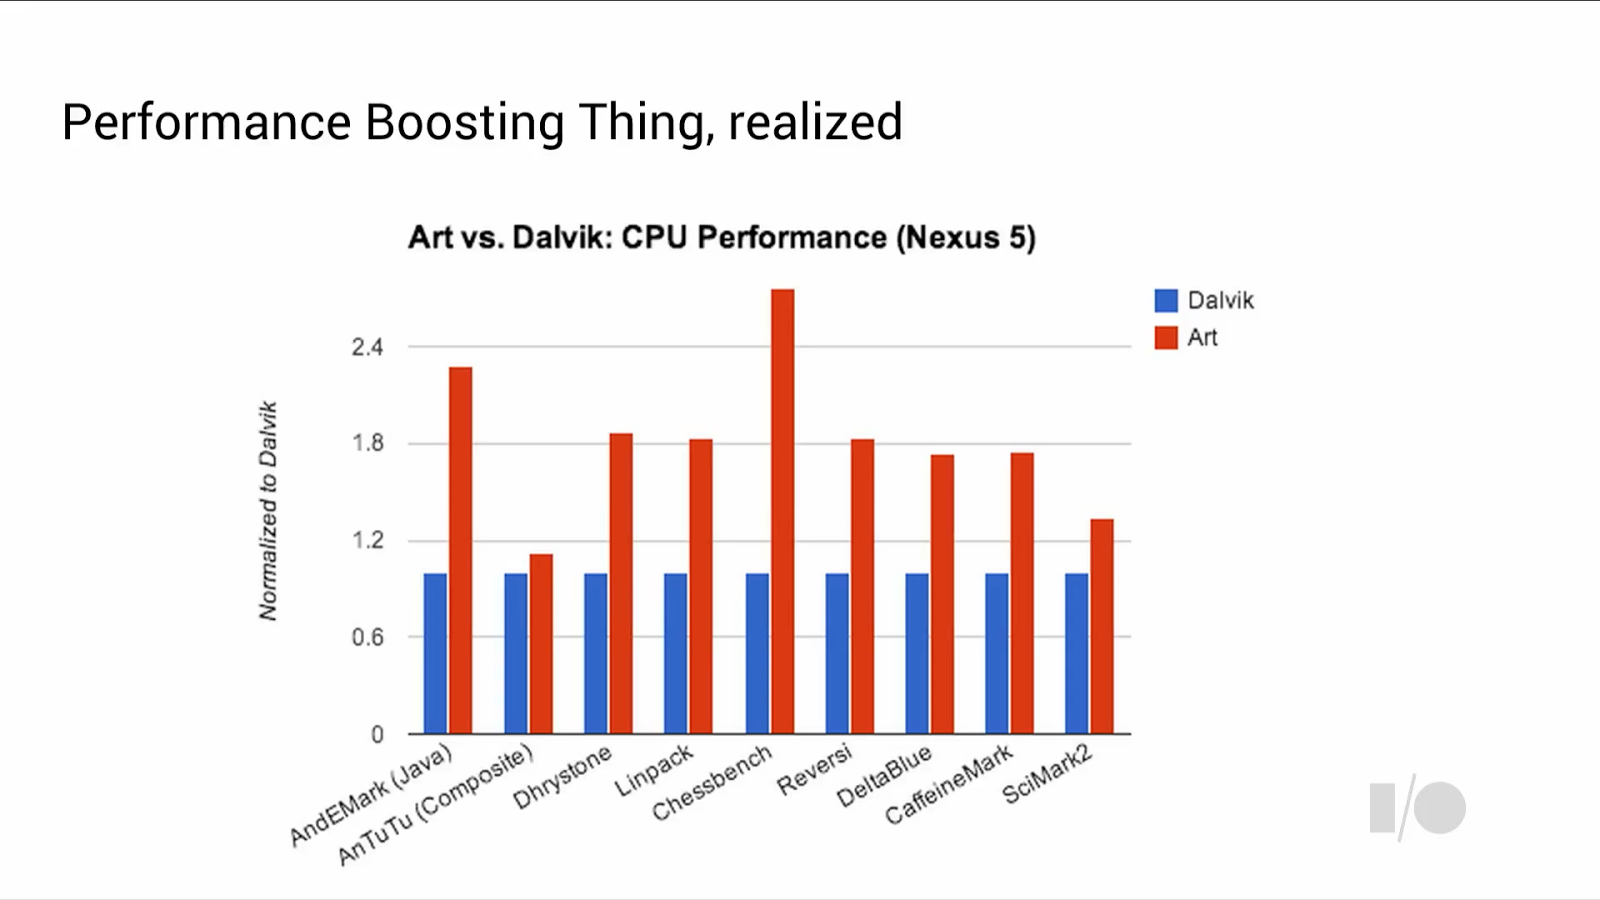
The performance gains over Dalvik are significant, as pictured above; the gains are roughly a 2x improvement in speed for code running on the VM. Google claimed that applications such as Chessbench that represent an almost 3x increase are a more representative projection of real-world gains that can be expected once the final release of Android L is made available.
Garbage Collection: Theory and Practice
Android’s VM relies upon an automatic memory management scheme; this cornerstone of the programming paradigm on which Java is based on has been a part of the Android ecosystem since its inception. For anybody unfamiliar with the concept, a quick explanation is that a programmer is neither in charge of having to either manually to reserve (allocate) physical memory nor freeing this memory up by himself once he is done with it. This is an important distinction to lower level programming languages where manual memory management is the norm. Of course, the advantage of automatic management is that it saves the developer from having to worry about memory management. The disadvantage is that the developer also no longer has control, and is at the whim of the system to correctly manage things in an optimal manner.
Android and Dalvik have traditionally suffered a lot from Dalvik’s garbage collection (GC) mechanism. Each time an application needed memory to be allocated and the heap (a space of memory dedicated to that app) would not be able to accommodate that allocation, the GC would fire up.
A GC’s job is to traverse the heap, enumerate all objects allocated by the application, mark all reachable objects (meaning, mark all objects that are still in use), and to free up whatever is left remaining.
In Dalvik’s case, this process resulted in two pauses; one during the enumeration phase, and one during the marking phase. A pause in this sense is that all code execution is halted for the totality of the application on all its threads. If the pauses are too big, this would result in dropped frames in the rendering of the application, which in turn resulted in jank and stuttering in the user experience.
Google claims the average duration of these pauses went up to 54ms on a Nexus 5 device, which results in a minimum of 4 dropped frames on average each time the GC would activate.
In my own experience and investigating, this number can blow up dramatically depending upon the application. For example, the official FIFA app is a poster child case in which garbage collection can run wild;
07-01 15:56:14.275: D/dalvikvm(30615): GC_FOR_ALLOC freed 4442K, 25% free 20183K/26856K, paused24ms, total 24ms
07-01 15:56:16.785: I/dalvikvm-heap(30615): Grow heap (frag case) to 38.179MB for 8294416-byte allocation
07-01 15:56:17.225: I/dalvikvm-heap(30615): Grow heap (frag case) to 48.279MB for 7361296-byte allocation
07-01 15:56:17.625: I/Choreographer(30615): Skipped 35 frames! The application may be doing too much work on its main thread.
07-01 15:56:19.035: D/dalvikvm(30615): GC_CONCURRENT freed 35838K, 43% free 51351K/89052K, paused3ms+5ms, total 106ms
07-01 15:56:19.035: D/dalvikvm(30615): WAIT_FOR_CONCURRENT_GC blocked 96ms
07-01 15:56:19.815: D/dalvikvm(30615): GC_CONCURRENT freed 7078K, 42% free 52464K/89052K, paused14ms+4ms, total 96ms
07-01 15:56:19.815: D/dalvikvm(30615): WAIT_FOR_CONCURRENT_GC blocked 74ms
07-01 15:56:20.035: I/Choreographer(30615): Skipped 141 frames! The application may be doing too much work on its main thread.
07-01 15:56:20.275: D/dalvikvm(30615): GC_FOR_ALLOC freed 4774K, 45% free 49801K/89052K, paused168ms, total 168ms
07-01 15:56:20.295: I/dalvikvm-heap(30615): Grow heap (frag case) to 56.900MB for 4665616-byte allocation
07-01 15:56:21.315: D/dalvikvm(30615): GC_FOR_ALLOC freed 1359K, 42% free 55045K/93612K, paused95ms, total 95ms
07-01 15:56:21.965: D/dalvikvm(30615): GC_CONCURRENT freed 6376K, 40% free 56861K/93612K, paused16ms+8ms, total 126ms
07-01 15:56:21.965: D/dalvikvm(30615): WAIT_FOR_CONCURRENT_GC blocked 111ms
07-01 15:56:21.965: D/dalvikvm(30615): WAIT_FOR_CONCURRENT_GC blocked 97ms
07-01 15:56:22.085: I/Choreographer(30615): Skipped 38 frames! The application may be doing too much work on its main thread.
07-01 15:56:22.195: D/dalvikvm(30615): GC_FOR_ALLOC freed 1539K, 40% free 56833K/93612K,paused 87ms, total 87ms
07-01 15:56:22.195: I/dalvikvm-heap(30615): Grow heap (frag case) to 60.588MB for 1331732-byte allocation
07-01 15:56:22.475: D/dalvikvm(30615): GC_FOR_ALLOC freed 308K, 39% free 59497K/96216K,paused 84ms, total 84ms
07-01 15:56:22.815: D/dalvikvm(30615): GC_FOR_ALLOC freed 287K, 38% free 60878K/97516K,paused 95ms, total 95ms
Above is a log extract of the first few seconds after launching the application. The garbage collector was invoked for a total of 9 times, causing the application to freeze for a total of 603ms, and a total of 214 dropped frames. Most of the pauses are caused by requests for memory allocation, as described by the “GC_FOR_ALLOC” tag in the log entries.
What ART promises and provides is a huge revamp of the whole garbage collection system, to virtually eliminate cases as the above. Here’s a comparison of the same situation under ART:
07-01 16:00:44.531: I/art(198): Explicit concurrent mark sweep GC freed 700(30KB) AllocSpace objects, 0(0B) LOS objects, 792% free, 18MB/21MB, paused186ustotal 12.763ms
07-01 16:00:44.545: I/art(198): Explicit concurrent mark sweep GC freed 7(240B) AllocSpace objects, 0(0B) LOS objects, 792% free, 18MB/21MB, paused198ustotal 9.465ms
07-01 16:00:44.554: I/art(198): Explicit concurrent mark sweep GC freed 5(160B) AllocSpace objects, 0(0B) LOS objects, 792% free, 18MB/21MB, paused224ustotal 9.045ms
07-01 16:00:44.690: I/art(801): Explicit concurrent mark sweep GC freed 65595(3MB) AllocSpace objects, 9(4MB) LOS objects, 810% free, 38MB/58MB, paused1.195ms total 87.219ms
07-01 16:00:46.517: I/art(29197): Background partial concurrent mark sweep GC freed 74626(3MB) AllocSpace objects, 39(4MB) LOS objects, 1496% free, 25MB/32MB, paused4.422ms total 1.371747s
07-01 16:00:48.534: I/Choreographer(29197): Skipped 30 frames! The application may be doing too much work on its main thread.
07-01 16:00:48.566: I/art(29197): Background sticky concurrent mark sweep GC freed 70319(3MB) AllocSpace objects, 59(5MB) LOS objects, 825% free, 49MB/56MB, paused6.139ms total 52.868ms
07-01 16:00:49.282: I/Choreographer(29197): Skipped 33 frames! The application may be doing too much work on its main thread.
07-01 16:00:49.652: I/art(1287): Heap transition to ProcessStateJankImperceptible took 45.636146ms saved at least 723KB
07-01 16:00:49.660: I/art(1256): Heap transition to ProcessStateJankImperceptible took 52.650677ms saved at least 966KB
The difference between ART and Dalvik couldn’t be bigger, as the new runtime manages to only pause for a total of 12.364ms over 4 foreground GC calls and two background GC calls. The heap did not need to grow at all during the application launch, in comparison to Dalvik’s 4 increases. The number of frames dropped diminished to 63.
Obviously this is a worst-case scenario of a badly developed application, as the application even in ART’s case still managed to drop a little over a second of frames, but bad programming practices such as overloading the UI thread is something that Android has to deal with on a regular basis.
ART offloads some of the work that is usually done by the garbage collector to the application itself, this eliminates the need for the execution pause during the enumeration phase. The second pause is vastly reduced by trying to do the work before the pause - a technique called packard pre-cleaning is applied, and the pause itself is reserved to a simply checking and validation of the work done. Google promises that they have managed to reduce these pauses to an average of 3ms, a good order of magnitude lower than presently achieved by the Dalvik GC.

The introduction of a special “Large Object Space” which is separate of the main heap, but still residing in the application memory, is destined to facilitate better handling of big objects such as bitmaps. These large primitive objects would cause great problems in terms of fragmenting the heap, causing more need for a GC invocation in case a new object needed to be allocated, but no continuous memory region big enough for it would be available. The frequency of GC invocations is thus greatly reduced due to less fragmentation of the memory heap and more intelligent allocation and elimination by the runtime.
Another good example is the launching of the Hangouts application; In Dalvik we see several GC pauses due to allocation calls:
07-01 06:37:13.481: D/dalvikvm(7403): GC_EXPLICIT freed 2315K, 46% free 18483K/34016K, paused3ms+4ms, total 40ms
07-01 06:37:13.901: D/dalvikvm(9871): GC_CONCURRENT freed 3779K, 22% free 21193K/26856K, paused3ms+3ms, total 36ms
07-01 06:37:14.041: D/dalvikvm(9871): GC_FOR_ALLOC freed 368K, 21% free 21451K/26856K, paused25ms, total 25ms
07-01 06:37:14.041: I/dalvikvm-heap(9871): Grow heap (frag case) to 24.907MB for 147472-byte allocation
07-01 06:37:14.071: D/dalvikvm(9871): GC_FOR_ALLOC freed 4K, 20% free 22167K/27596K, paused25ms, total 25ms
07-01 06:37:14.111: D/dalvikvm(9871): GC_FOR_ALLOC freed 9K, 19% free 23892K/29372K, paused27ms, total 28ms
We have a good extract of all GC cases in the above log. The explicit and concurrent GC calls are the general cleanup and maintenance calls of the GC. The for_alloc calls are cases where the memory allocator is trying to allocate something but it doesn’t fit in the heap, and a GC is launched to try to make space. In the middle we see that the heap was expanded due to fragmentation and not being able to hold a larger object. The total “dead time” ends up at 90ms. In comparison, here’s the current ART extract in the L preview:
07-01 06:35:19.718: I/art(10844): Heap transition to ProcessStateJankPerceptible took 17.989063ms saved at least -138KB
07-01 06:35:24.171: I/art(1256): Heap transition to ProcessStateJankImperceptible took 42.936250ms saved at least 258KB
07-01 06:35:24.806: I/art(801): Explicit concurrent mark sweep GC freed 85790(3MB) AllocSpace objects, 4(10MB) LOS objects, 850% free, 35MB/56MB, paused961us total 83.110ms
We’re not quite sure on what the heap transition lines represent, but we’ll assume they’re the heap resizing mechanisms. The only GC call is after the app is launched already and comes at a minuscule 961µS. We don’t see any of the previous calls to the GC. What is interesting, is the LOS statistics. We see that we have 4 large objects at 10MB in the LOS, allocation that would have otherwise been resided in heap space now totally foregoes it, and with that, avoids the repeated for_alloc GC calls and heap fragmentation that plagued Dalvik.
The memory allocation system itself was also revamped. While ART itself provided an about 25% boost over Dalvik, Google was not happy with this and introduced a new memory allocator replacing the currently used “malloc” allocator.
This new allocator, “rosalloc” or Runs-of-Slots-Allocator, was developed in mind for the usage cases of multithreaded Java applications. The new allocator has a more fine-grained locking mechanisms which can lock on individual bins of objects instead of the whole memory allocation itself. Small objects in thread local regions are able to completely forego locking altogether.
The result is a huge improvement in allocation speed, resulting in up to a 10x gain.
The garbage collection algorithms themselves have been reworked to improve the user experience and to avoid interruptions of the application. These algorithms are still a work in progress and Google has only recently introduced a new dedicated algorithm, the “Moving garbage collector” whole sole purpose is to defragment the application heap while applications are in the background.
64-Bit Support
ART was designed in mind with modularity of the various target architectures in which it is supposed to run on. As such, it provides a multitude of compiler-backends targeting today’s most common architectures such as ARM, x86 and MIPS. In addition, 64-bit support for ARM64, x86-64 and while still not implemented, also MIPS64.
While we have gone more in depth of the advantages and implications of switching over to 64-bit architecturesin the iPhone 5s review, the main points to take away are the availability of an increased address space, generally increased performance, and vastly increased cryptographic capabilities and performance, all while maintaining full 32-bit compatibility with all existing apps.
An important difference that Google is applying over Apple, at least inside VM runtime applications, is that they are using reference compression to avoid the usual memory bloat that comes with the switch to 64-bit. The VM retains simple 32-bit references.
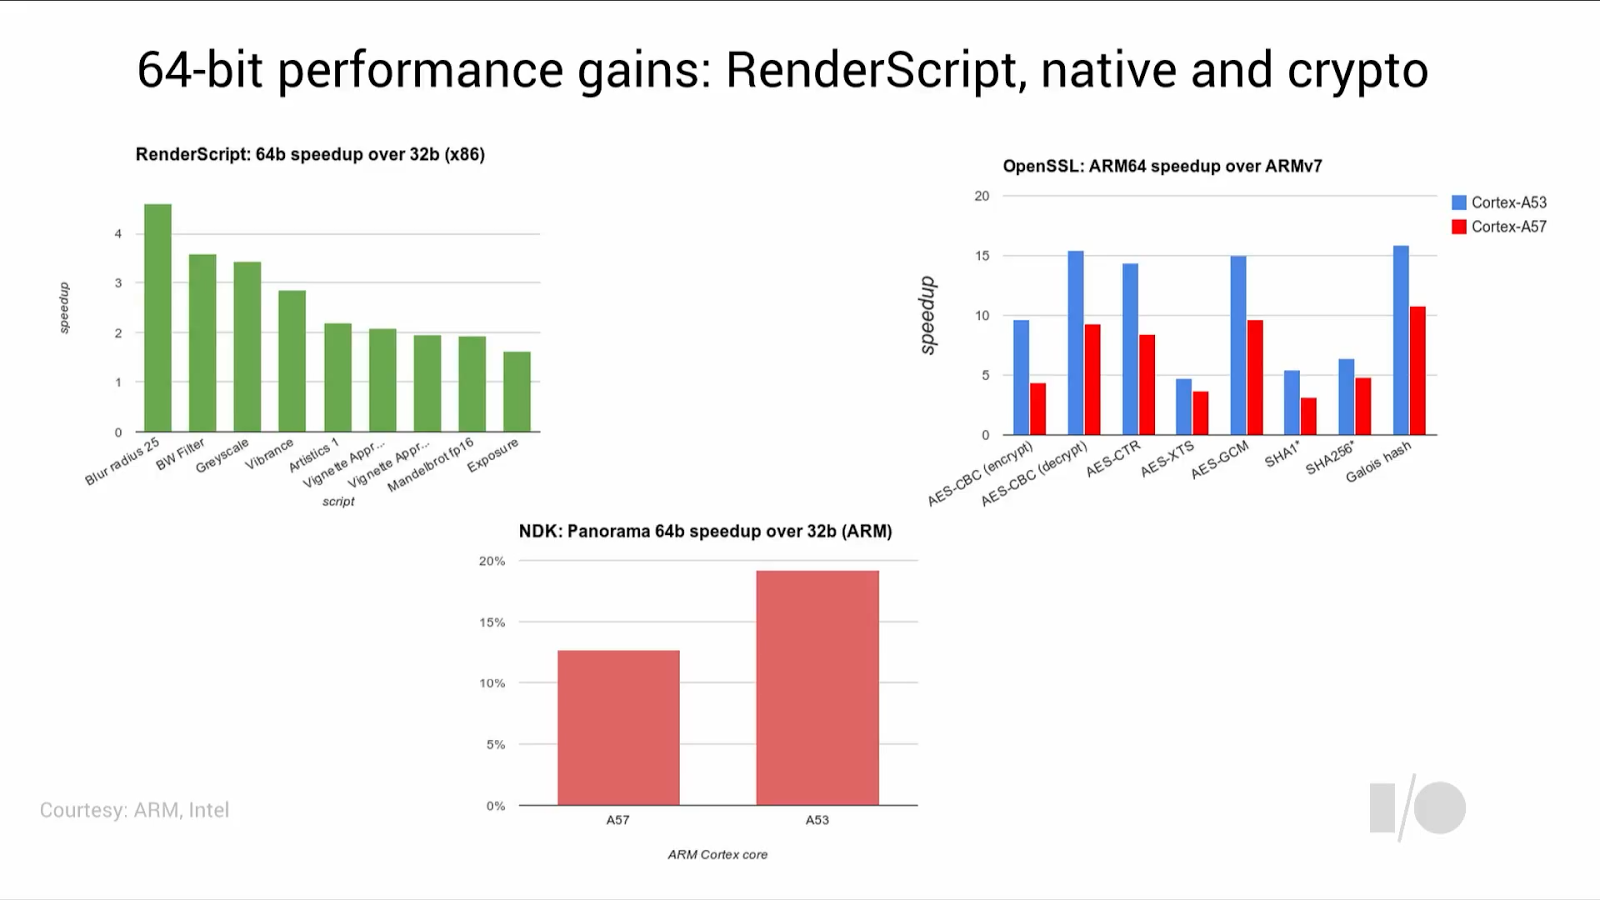
Google has made available some preview benchmarks showcasing the performance gains both on x86 and ARM platforms. The x86 benchmarks were executed on a Intel BayTrail system, and show a 2x to 4.5x speedup in various RenderScript benchmarks. On the ARM side, the crypto performance gains over 32-bit were showcased on an A57/A53 system. Both of these are relatively non-representative of one should really expect in real-world use-cases so they’re not that useful as a performance prediction.
However Google also made some interesting numbers available on one of their internal build-systems called Panorama. Here we can see a 13 to 19% increase in performance by simply switching over the ABI. It is also good to see how ARM’s Cortex A53 is able to make a bigger impact on performance when in AArch64 mode than the A57 cores.
Google claims that 85% of all current Play Store apps are immediately ready to switch over to 64 bit - which would mean that only 15% of applications have some kind of native code that needs targeted recompiling by the developer to make use of 64-bit architectures. This is a great win for Google and I expect the shift over to 64-bit to be very fast once silicon vendors start shipping 64-bit SoCs in the coming year.
Conclusion
In many points, Google has delivered its “Performance boosting thing” and addressed much of the shortcomings that have plagued Android for years.
ART patches up many of the Achilles’ heels that comes with running non-native applications and having an automatic memory management system. As a developer, I couldn’t have asked for more, and most performance issues that I needed to work around with clever programming no longer pose such a drastic problem anymore.
This also means that Android is finally able to compete with iOS in terms of application fluidity and performance, a big win for the consumer.
Google still promises to evolve ART in the future and its current state is definitely not what it was 6 months ago, and definitely not what it will be once the L release is made available in its final form in devices. The future looks bright and I can’t wait to see what Google will do with its new runtime.

PIPELINE STORIES
+ Submit News- Antec CES Suite Tour
- QNAP Releases Haswell-based TVS-x71 and Cortex-A15-based TS-x31+ NAS Lineups
- The AnandTech Podcast: Episode 30 - CES 2015 Show
- be quiet! CES Suite Tour
- Samsung Launches SM951 M.2 PCIe 3.0 x4 SSD for OEMs/SIs
- ioSafe Updates Disaster-Resistant Storage Lineup at CES 2015
- IOGEAR Updates A/V & Digital Home Solutions for 4K
- G-Technology's Evolution Series Goes Rugged
- Zotac Updates ZBOX mini-PC Lineup at CES 2015
TWEETS 
- ganeshts:RT @anandtech: QNAP Releases Haswell-based TVS-x71 and Cortex-A15-based TS-x31+ NAS Lineups http://t.co/Dib9ctrnBM
- RyanSmithAT:RT @anandtech: The AnandTech Podcast: Episode 30 - CES 2015 Show http://t.co/WKs3aWpbQL
- IanCutress:@kristianvatto you'll probably see this first: left you a message on skype
- IanCutress:@jeffkibuule Not per se, but it is easier to get distracted when you're not in the mood to work.
- IanCutress:@fmanjoo @sdadich I like offices. Helps separate work from home life with a physical distance, rather than making a spare room an office
- IanCutress:@LinusTech Can you DM me your email? Got a quick Q about Dell sampling to Canada.
- IanCutress:Am I done with CES? Am I actually done with CES now? Perhaps one more email. Or three. Then waiting for responses. The reviews. #techlife
- ganeshts:. @vijay_sammeta I hope that increases probability of @googlefiber in San Jose. Wasn't 2014 end supposed to bring some updates?
- RyanSmithAT:@IanCutress You spoke too soon and doomed @Hunt3rj2 . https://t.co/Bc5zr8ZBfE
- ganeshts:Amongst the consumer networking vendors, @Dlink had the most interesting suite at CES 2015.. http://t.co/Dg4aRCU0Pg
- RyanSmithAT:RT @anandtech: AMD’s Carrizo not on the Desktop? Depends What You Define as Desktop http://t.co/P1XsoAFbyg
- ganeshts:If you are an @Asustor NAS user / prospective customer, would love to have some inputs in this thread: http://t.co/52VeCSNEKf
- RyanSmithAT:@ryszu It doesn't seem so. It looks like it needs to be running on Apple software. Not that it stops anyone. http://t.co/Ui4d0Y6hMF Sec. B.3
- jarredwalton:#Gigabyte and #AORUS win for best #CES2015 T-shirt. I guess they think I need more exercise. LOL http://t.co/GGfcDp2rPw
- ganeshts:RT @anandtech: AMD Enters NAS Market with QNAP's 10G-Ready TVS-x63 http://t.co/0qg7Bmwp3y
- RyanSmithAT:@IanCutress Hopefully we're all healthy, but don't count your chickens just yet. Incubation periods can still get you
- jarredwalton:Rocking the Bellingham International free WiFi. And it only took 30 minutes to connect. http://t.co/rwMZCQXOS2
- jarredwalton:ATT via #straighttalk at #McCarran is a bit lacking, sadly. http://t.co/FeA1lXdlEb @vivg91
- jarredwalton:@TwittBren Nothing official yet. We never saw Tahiti in notebooks so we may not see Tonga either. iMac can dissipate a lot more heat.
- jarredwalton:@equinoxe3d @anandshimpi @nerdtalker And my stomach is thankful to have a good excuse to stay away from the Mint Indian Bistro. Hahaha.
- A closer look at Android ART in AndroidL
- A closer look at the Android project build system part I
- A closer look at the Android project build system part II
- A Closer Look At SQL Server Compact Edition
- [zz]A Closer Look At the Blueprint CSS Framework
- A Closer Look at 32-Bit vs. 64-Bit Windows
- A Closer Look At Hub, Switch And Router
- A Closer Look at Mikrotik CRS317-1G-16S+RM
- CSRF Protection in CodeIgniter 2.0: A closer look (From Bastian Heist)
- 小目标检测--A closer look: Small object detection in Faster R-CNN
- (apple官方文档译文)深入理解表视图的单元格(cells)- A Closer Look at Table View Cells
- A Look At Android Support Annotations
- A first hand look at building an Android application
- A First Look at the Android Testing Framework
- Take a look at this
- Have a look at what’
- A look at WeChat security
- SQL2008数据压缩功能之一瞥(A Quick Look At Compression In SQL 2008)
- SharePoint 2013 Nintex Workflow 工作流帮助(四)
- java三大框架
- 光标移出显示提示语
- [开心学php100天]第二天:疯狂的数组
- 好友列表排序,分组
- A closer look at Android ART in AndroidL
- [开心学php100天]第三天:不羁的PHP文件操作
- QCIF CIF 2CIF 4CIF 普及
- [LeetCode]1.Two Sum
- 解决Cisco VPN Client Reason 442: Failed to Enable Virtual Adapter
- 高薪IT行业--创新者的解答
- iOS开发的一些奇巧淫技
- ios开发 企业证书ipa安装包 分发(.plist .ipa)
- CentOS6.6下编译安装mysql5.6