how-to-use-grahite-and-grafana-to-monitor-spark
来源:互联网 发布:genbank数据库记录 编辑:程序博客网 时间:2024/06/05 23:47
how-to-use-grahite-and-grafana-to-monitor-spark
写作缘由:最近看到spark社区有人使用 graphite-grafana监控spark,
spark-developers-list Monitoring Spark with Graphite and Grafana
hammerlab Monitoring Spark with Graphite and Grafana
github grafana-spark-dashboards
因为工作中涉及spark监控,故测试一下,记录如下:
首先,看看graphite+grafana的监控效果:
- graphite-web展示的效果:
自己测试的web展示,对metric的graph 定制操作还不太熟悉,比较原始不美观,这里先看看Graphite 简介里的两张图片。 
Graphite brower web interface 
Graphite CLI web interface
- grafana-web的监控 spark 的展示效果:感觉比 ganglia 的效果好一些
自己测试的web展示,对metric的graph 定制操作还不太熟悉,比较原始不美观,这里先看看hammerlab一篇博文Monitoring Spark with Graphite and Grafana里的几张图片。
Task Completion Rate
HDFS I/O
JVM statistics exported by Spark
1 graphite 简介
1)是什么?发展情况
Graphite is an enterprise-scale monitoring tool that runs well on
cheap hardware. It was originally designed and written by Chris Davis
at Orbitz in 2006 as side project that ultimately grew to be a
foundational monitoring tool. In 2008, Orbitz allowed Graphite to be
released under the open source Apache 2.0 license. Since then Chris
has continued to work on Graphite and has deployed it at other
companies including Sears, where it serves as a pillar of the
e-commerce monitoring system. Today many large companies use it.Graphite是一个企业级的监控工具,可以在廉价机硬件上运行。 最初由Chris Davis在 Orbitz
工作时,作为一个辅助项目在2006年使用Python语言编写,最终成一个基本的监控工具。 在2008,Orbitz
允许软件以开源Apache 2.0 license的授权方式发行。 从那之后 Chris继续开发这个软件,并将其部署在其它公司,包括
Sears, 使得Graphite成为电子商务监控系统的一个支柱。今天有很多大公司使用它。
闲话Orbitz
Orbitz Worldwide公司(Nasdaq:OWW)是全球领先的在线旅游公司,采用创新的技术帮助休闲和商务旅行者研究、计划和预订全面的旅行产品
Orbitz成立于1999年,当时,美国的旅游业发展迅速,Orbitz也就趁势而入。Orbitz的航空公司投资者包括全美航空,三角洲航空,西北航空公司和联合航空公司。Orbitz网站成立于2001年,在2004年11月的时候被Cendant收购,成为了Cendant的国内在线旅游服务部门,于2007年上市。
20150213,
艺龙(纳斯达克股票代码:LONG)网的大股东——在线旅游服务网站Expedia将以每股12美元的价格(16亿美元)收购另一家美国在线旅游网站Orbitz,以此向美国最大在线旅游服务网站Priceline发起挑战。
2)功能,能做什么?
What Graphite is and is not Graphite does two things:
Store numeric time-series data Render graphs of this data on demand
What Graphite does not do is collect data for you, however there are
some tools out there that know how to send data to graphite. Even
though it often requires a little code, sending data to Graphite is
very simple.Graphite 功能 Graphite是一个画图工具?,将数据以图形的方式展现出来。它主要做两件事:
- 存储时间序列数据
- 根据需要呈现数据的图形
Graphite不收集数据,有一些工具知道如何发送数据给Graphite
3)架构 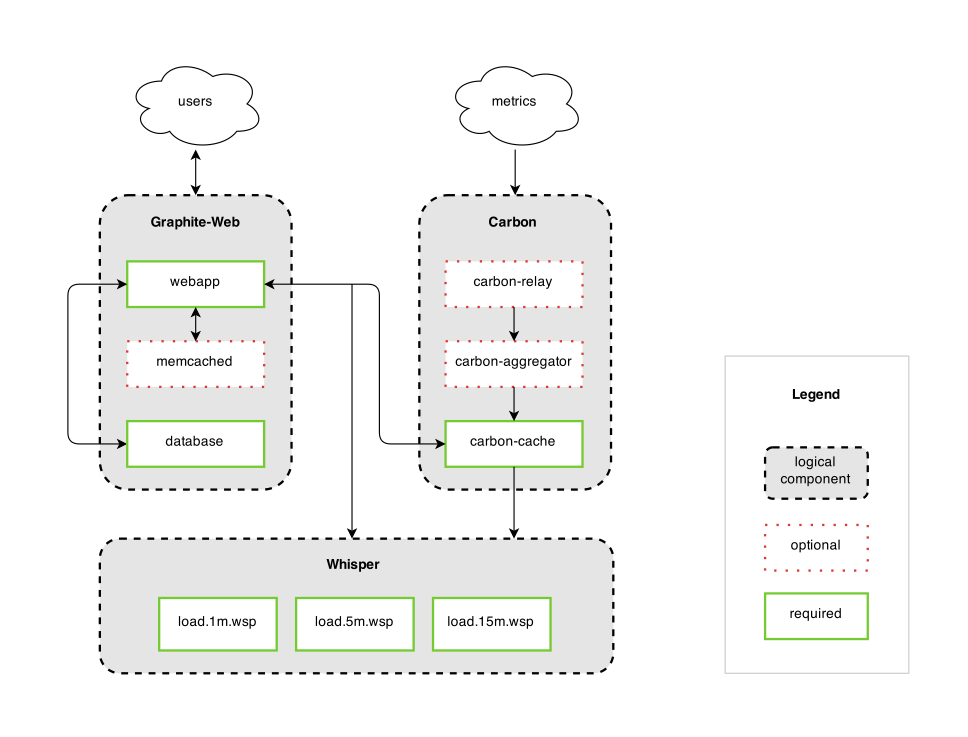
graphite 架构图1

graphite 架构图2
4)
参考资料
#graphite
英文
graphite wikidot/website
graphite high level diagram
文章中有架构图
Graphite wiki how-to
graphite docs Overview
graphite docs FQA
最后有一张架构图
Questions forum on Launchpad
graphite website installation
graphite docs installation
[10 Things I Learned Deploying Graphite — Kevin McCarthy]https://kevinmccarthy.org/blog/2013/07/18/10-things-i-learned-deploying-graphite/
中文
Graphite 简介
该文部分是对 [graphite Overview] 的翻译
Graphite 安装和常见问题
该文部分是对 [graphite docs installation] 的翻译
Carbon FAQ – Graphite 中文版
Graphite Url Api 教程
Graphite dashboard 使用指南
Graphite CLI 教程
2 为什么关注 graphite ?
spark 监控的技术有哪些?
- 1) ganglia
组件 gmond //client端, c编写 gmetad //server端, c编写 rrd //存储
gweb //php编写,模板框架 httpd/nginx + phpd //提供 web服务memcached //gmetad 写 io 优化
优点:安装部署简单,spark metricsSystem 支持,能够进行常用指标的实时与历史信息
不足:不支持告警,graph控制不够灵活
2) nagios
组件和优点/不足,待整理补充3) ambari(ganglia + nagios + puppet + hadoop)
组件
ambari-agent
ambari-server
ambari-web
优点与不足:待整理补充
- 4) graphite + grafana
架构:
Graphite consists of 3 software components: carbon - a Twisted daemon
that listens for time-series data whisper - a simple database library
for storing time-series data (similar in design to RRD) graphite
webapp - A Django webapp that renders graphs on-demand using CairoGraphite由三个软件组件组成: carbon - 一个Twisted守护进程,监听时间序列数据 whisper –
一个简单的数据库库,用来存储时间序列数据,在设计上类似于RRD graphite webapp – Django webapp,使用
Cairo来根据需要呈现图形
闲话Twisted
Twisted is an event-driven networking engine written in Python and
licensed under the open source
我看到的最棒的Twisted入门教程!
Grafana
Graphite-web 自带的界面不够美观,这里使用 grafana ,
Grafana is a general purpose dashboard and graph composer. It’s
focused on providing rich ways to visualize time series metrics,
mainly though graphs but supports other ways to visualize data through
a pluggable panel architecture. It currently has rich support for for
Graphite, InfluxDB and OpenTSDB. But supports other data sources via
plugins.
grafana是一种通用的仪表板和图形的专业生成软件。它专注于提供丰富的方式来可视化时间序列指标,主要通过图形,也支持通过一个可插拔的面板结构提供其他的方式可视化数据。它目前对
Graphite, InfluxDB and OpenTSDB 数据源支持非常丰富。也可以通过插件支持其他数据源。
部署测试graphite+grafana监控spark要安装的相关软件
python+easy_install+pip
Django
carbon //server端, 接收 metrics, python编写
whisper //server端, 存储 metrics, python编写
graphite-web // web前端展示
httpd/nginx
grafana //web 前端展示memcached //io优化
hammerlab/grafana-spark-dashboards
优点:待整理
结合grafana 展示的图表确实很艳丽(参考上面的图表)
不足:
涉及技术多
测试过程,部署复杂;使用不够简单
相关技术:
Tools That Work With Graphite
如何开发graphite-web
Working on Graphite-web
官方列举的使用公司
Who is using Graphite?
3 怎么用 graphite 监控 spark
测试拓扑
3个节点 主机名:spark1/spark2/spark3
部署 hadoop/spark 集群(略)
1个节点 主机名:monitor1
部署 python + esay_install + pip + graphite(carbon+whisper+graphite-web) + httpd + grafana + hammerlab/grafana-spark-dashboards
1 安装
参考链接
graphite website installation
graphite docs installation
Graphite 安装和常见问题
该文部分是对 [graphite docs installation] 的翻译
参考 how-to-install-graphite-on-centos6.6-x86_64
参考 how-to-install-grafana-on-centos6.6-x86_64
2 配置 spark 向 graphite 发 metric 数据
vi conf/metrics.properites
# org.apache.spark.metrics.sink.GraphiteSink# Name: Default: Description:# host NONE Hostname of Graphite server# port NONE Port of Graphite server# period 10 Poll period# unit seconds Units of poll period# prefix EMPTY STRING Prefix to prepend to metric name# protocol tcp Protocol ("tcp" or "udp") to use*.source.jvm.class=org.apache.spark.metrics.source.JvmSource#master.source.jvm.class=org.apache.spark.metrics.source.JvmSource#worker.source.jvm.class=org.apache.spark.metrics.source.JvmSource#driver.source.jvm.class=org.apache.spark.metrics.source.JvmSource#executor.source.jvm.class=org.apache.spark.metrics.source.JvmSource#Enable GraphiteSink*.sink.Graphite.class=org.apache.spark.metrics.sink.GraphiteSink*.sink.Graphite.host=monitor1*.sink.Graphite.port=2003spark standalone需要分发metrics.properties
scp metrics.properties spark2:~/app/spark/conf/scp metrics.properties spark3:~/app/spark/conf/3 graphite-web 查看 spark metrics graph
web访问: http://monitor1:61080
更新20150320:
这里看看 graphite对metric的定制功能: 
graphite-web默认以树形结构组织metrics,然后选择要查看的metric,就可以展示

graphite也支持自定义dashboard,选择需要展示的一些metrics,进行组合操作,访问dashboard可以展示定制的任何metrics graph
4 grafana 查看 spark metrics graph
brower访问:http://monitor1:61081
更新:20150320
首页显示如下: 
grafana-web首页

在自定义的dashboard上创建自定义graph,可以选择任意想要展示的metrics

自己创建的dashboard,展示了 load, mem, jvm_heap相关的指标
grafana常见问题:
问题1:grafana web 添加 graphic 不能选择 metric,导致不能完成定制
grafana-web日志没有相关错误
原因:
参考Troubleshooting
查看首页,发现 grafana的 graph panel 提示 connected
使用 firefox ->tools->web developers->toggle tools(option+commond+I)
发现提示 Cross-Origin Request Blocked
处理方法1:
CORS on Apache
To add the CORS authorization to the header using Apache, simply add the following line inside either the , , or sections of your server config (usually located in a *.conf file, such as httpd.conf or apache.conf), or within a .htaccess file:
Header set Access-Control-Allow-Origin “*”
vi /etc/httpd/conf.d/graphite-vhost.conf
在 部分,添加
Header set Access-Control-Allow-Origin “*”
apachectl -t
service httpd reload
结果: grafana web 能正常添加 metric
5测试 grafana-spark-dashboards
github grafana-spark-dashboards
Note
grafana-spark-dashboards目前仅提供监控spark-on-yarn模式下dashboard,对于standalone模式下的监控好像还不支持
1) install
git clone https://github.com/hammerlab/grafana-spark-dashboards.git
cd grafana-spark-dashboards
cp spark.js /data/grafana/app/dashboards/
cd /data/grafana/app/dashboards/
cp spark.js spark.js.org
vi spark.js
a 查找 fetchYarnApps 设置 spark.js try to hit
http://spark1:8088/ws/v1/cluster/apps, which should be your YARN RM’s
JSON API (try this with a curl first to be sure).
jQuery.ajax(‘http://spark1:8088/ws/v1/cluster/apps‘, {
2)测试grafana-spark-dashboards 监控 spark-app running on yarn
测试 http://monitor1:61081/#/dashboard/file/spark.js
问题1: http://monitor1:61081/#/dashboard/file/spark.js 访问失败,web提示Error Could not load dashboards/spark.js. Please make sure it exists ,日志提示
[Thu Mar 12 09:23:42 2015] [error] [client 192.168.99.1] File does not
exist: /var/www/html/grafana/app/dashboards/spark, referer:
http://monitor1:61081/
处理方法1:
mkdir /var/www/html/grafana/app/dashboards/sparkchown -R apache /var/www/html/grafana/app/dashboards/spark结果:问题依旧:日志提示
[Thu Mar 12 09:27:29 2015] [error] [client 192.168.99.1] File does not
exist: /var/www/html/grafana/app/dashboards/spark/js, referer:
http://monitor1:61081/
处理方法2:
mkdir /var/www/html/grafana/app/dashboards/spark/jschown -R apache /var/www/html/grafana/app/dashboards/spark/js结果:web可以进行操作,apache日志没有报错
更新20150320
使用 grafana-spark-dashboards 监控 spark应用访问 http://monitor1:61081/#/dashboard/file/spark.js 目前需要提供参数
test steps:
(1)step1: submit a spark-streaming example NetworkWordCount to yarn using spark-submit
#yarn-clientterminal1nc -lk 9999terminal2export SPARK_HOME=/data01/app/spark/spark-1.2.1-SNAPSHOT-bin-2.3.0-cdh5.1.3export SPARK_HOME=$(pwd)SPARK_APP_JAR=$SPARK_HOME/examples/target/spark-examples_2.10-1.3.0-SNAPSHOT.jar./bin/spark-submit \--class org.apache.spark.examples.streaming.NetworkWordCount \--master yarn-client \--driver-memory 300M \--executor-memory 300M \--num-executors 2 \--executor-cores 1 \--files conf/metrics.properties \$SPARK_APP_JAR \spark1 9999(2)step2: get YARNAppID from yarn WebUI
示例:YARNAppID=application_1426815734479_0001
(3)step3: access grafana-spark-dashboard to monitor specific YARNAppID http://monitor1:62081/#/dashboard/script/spark.js?app=application_1426815734479_0001
问题:访问报错,具体信息见:
spark-developers-listMonitoring Spark with Graphite and Grafana
问题已解决
Need some FQA while using grafana-spark-dashboards
这里看看 grafana-spark-dashboards 展示效果 
grafana-spark-dashboards 展示效果
进展:
20150313,测试到grafana-web使用grafana-spark-dashboards查看spark指标时,目前遇到一些问题,对 grafana web 上定制 graph 的操作不够熟悉,grafana-spark-dashboards 的使用有些问题
20153020: 能够在 grafana-web定制自定义的dashboard,但测试github社区项目grafana-spark-dashboards 时,遇到CORS(cross-origin request sharing)问题
20150327更新: 20130323解决使用 grafana-spark-dashboards 过程中遇到的问题
- how-to-use-grahite-and-grafana-to-monitor-spark
- Use Prometheus+Grafana to monitor the Internet backbone connectivity quality
- how-to-configure-and-use-spark-history-server
- How-to: use spark to suport query across mysql tables and hbase tables
- How to use the Automatic Database Diagnostic Monitor (ADDM)
- How to install and use doxygen
- How to Create and Use the DLL
- How To Use Function 'F4_FILENAME' and 'KD_GET_FILENAME_ON_F4'
- standard exception and how to use
- How to use 'SetItemData()' and 'GetItemData()'?
- How to use the CONVERSION_EXIT_PARVW_INPUT and CONVERSION_EXIT_PARVW_OUTPUT
- How To Choose and Use Strong Passwords
- how to config and use apt-get
- What and How to use JSF
- How to use NSString and NSMutableString
- How to use appreciation and lie
- How to use calltree and Graphviz/CodeViz
- How to configure and use CAN bus
- nginx的安装
- SNMP从入门到开发:进阶篇
- Model-1模式的分页逻辑
- ubuntu 在虚拟机环境下显示联网但无法连接外网的解决办法(利用虚拟网络编辑器)
- css
- how-to-use-grahite-and-grafana-to-monitor-spark
- 新提交审核app保留检查更新入口将被拒绝
- Android开机自动运行程序
- Android层次化安全架构及核心组件概览
- Drop table相关处理
- SpringMVC上传下载
- linux 终端速度显示
- Codeigniter中禁止A Database Error Occurred错误提示
- 浅析Android系统架构及内核