plot.xts时间序列可视化
来源:互联网 发布:单片机四路抢答器程序 编辑:程序博客网 时间:2024/05/03 07:37
前言
r-bloggers的一篇博文,让我有动力继续发现xts的强大。xts扩展了zoo的基础数据结构,并提供了更丰富的功能函数。xtsExtra补充库,从可视化的角度出发,提供了一个简单而效果非凡的作图函数plot.xts。
本文将用plot.xts来演示,xts对象的时间序列可视化!
目录
- xtsExtra介绍
- xtsExtra安装
- plot.xts的使用
1. xtsExtra介绍
xtsExtra是xts包的功能补充包,该软件包在Google Summer of Code 2012被开发,最终将合并到xts包。xtsExtra提供的主要功能就是plot.xts。
注:我发现xts::plot.xts的函数,与xtsExtra::plot.xts还是有差别的。
关于xts包的介绍,请参考文章:可扩展的时间序列xts
下面我们安装xtsExtra包。
2. xtsExtra安装
由于xtsExtra没有发布到CRAN,我们要从R-Forge下载。
~ R> install.packages("xtsExtra", repos="http://R-Forge.R-project.org")Warning in install.packages : package ‘xtsExtra’ is not available (for R version 3.0.1)trying URL 'http://R-Forge.R-project.org/bin/windows/contrib/3.0/xtsExtra_0.0-1.zip'Content type 'application/zip' length 242682 bytes (236 Kb)opened URLdownloaded 236 Kbpackage ‘xtsExtra’ successfully unpacked and MD5 sums checkedThe downloaded binary packages are inC:\Users\Administrator\AppData\Local\Temp\Rtmp04stLd\downloaded_packages加载xtsExtra
> library(xtsExtra)载入需要的程辑包:zoo载入程辑包:‘zoo’下列对象被屏蔽了from ‘package:base’: as.Date, as.Date.numeric载入需要的程辑包:xts载入程辑包:‘xtsExtra’下列对象被屏蔽了from ‘package:xts’: plot.xtsWarning messages:1: 程辑包‘zoo’是用R版本3.0.2 来建造的 2: 程辑包‘xts’是用R版本3.0.2 来建造的 plot.xts函数被用来,覆盖xts::plot.xts函数。
3. plot.xts的使用
- 1). plot.xts的参数列表
- 2). 简单的时间序列
- 3). K线图
- 4). panel配置
- 5). screens配置
- 6). events配置
- 7). 双时间序列
- 9). barplot
1). plot.xts的参数列表
> names(formals(plot.xts)) [1] "x" "y" "screens" "layout.screens" "..." [6] "yax.loc" "auto.grid" "major.ticks" "minor.ticks" "major.format" [11] "bar.col.up" "bar.col.dn" "candle.col" "xy.labels" "xy.lines" [16] "ylim" "panel" "auto.legend" "legend.names" "legend.loc" [21] "legend.pars" "events" "blocks" "nc" "nr" 2). 简单的时间序列
> data(sample_matrix)> sample_xts <- as.xts(sample_matrix)> plot(sample_xts[,1]) > class(sample_xts[,1])[1] "xts" "zoo"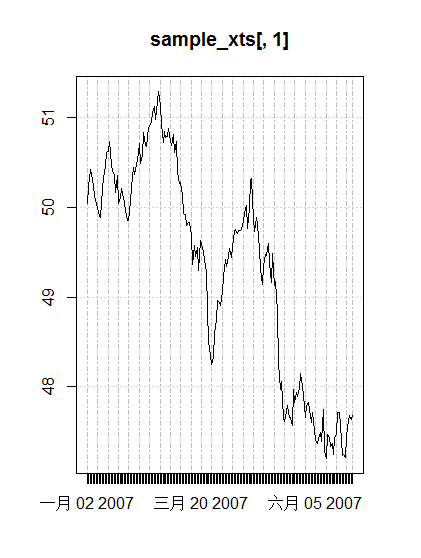
3). K线图
红白色
> plot(sample_xts[1:30, ], type = "candles")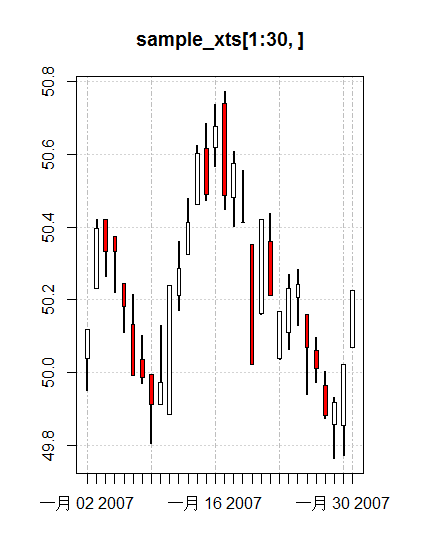
自定义颜色
> plot(sample_xts[1:30, ], type = "candles", bar.col.up = "blue", bar.col.dn = "violet", candle.col = "green4")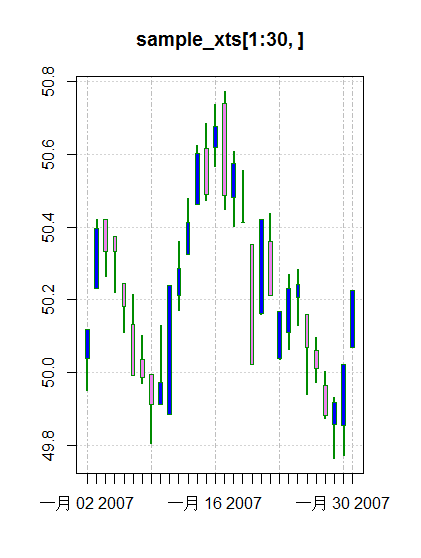
4). panel配置
基本面板
> plot(sample_xts[,1:2]) 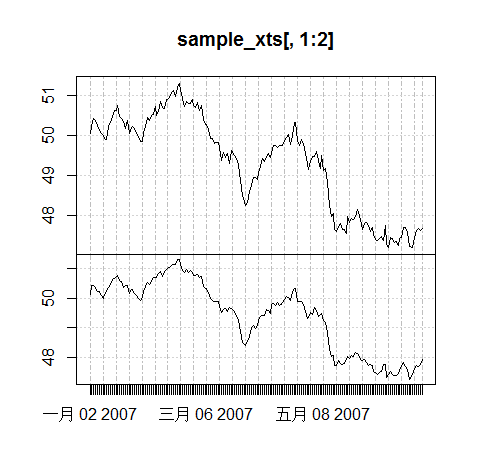
多行面板
> plot(sample_xts[,rep(1:4, each = 3)]) 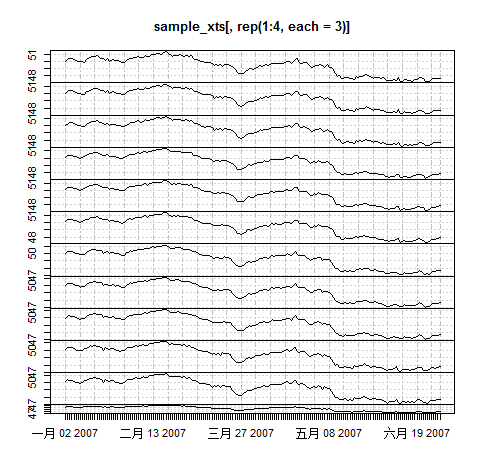
自由组合面板
> plot(sample_xts[,1:4], layout.screens = matrix(c(1,1,1,1,2,3,4,4),ncol = 2, byrow = TRUE))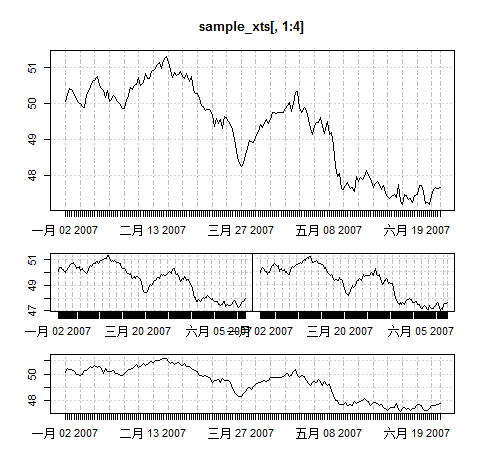
5). screens配置
双屏幕显示,每屏幕2条线
> plot(sample_xts, screens = 1:2) 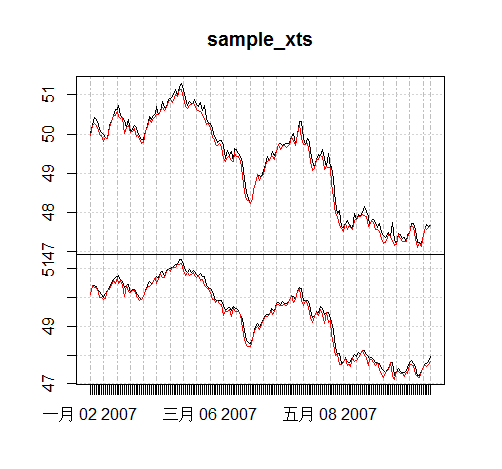
双屏幕显示,指定曲线出现的屏幕和颜色
> plot(sample_xts, screens = c(1,2,1,2), col = c(1,3,2,2))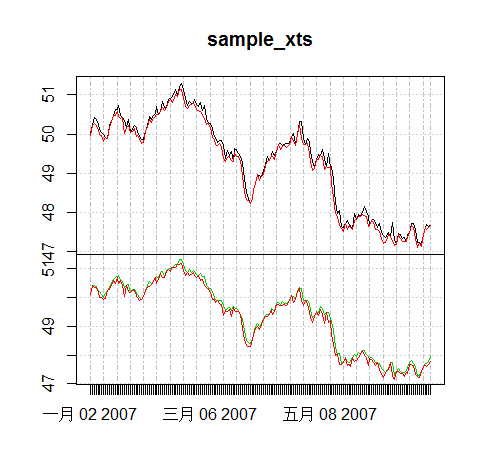
双屏幕显示,指定不同的坐标系
> plot(10^sample_xts, screens = 1:2, log= c("","y"))
双屏幕显示,指定不同的输出图形
> plot(sample_xts[1:75,1:2] - 50.5, type = c("l","h"), lwd = c(1,2))
多屏幕,分组显示
> plot(sample_xts[,c(1:4, 3:4)], layout = matrix(c(1,1,1,1,2,2,3,4,5,6), ncol = 2, byrow = TRUE), yax.loc = "left")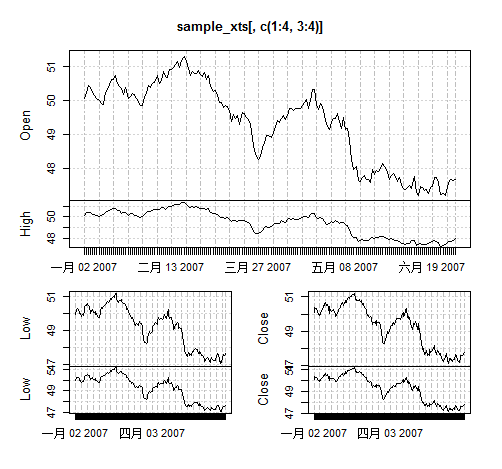
6). events配置
基本事件分割线
> plot(sample_xts[,1], events = list(time = c("2007-03-15","2007-05-01"), label = "bad days"), blocks = list(start.time = c("2007-03-05", "2007-04-15"), end.time = c("2007-03-20","2007-05-30"), col = c("lightblue1", "lightgreen")))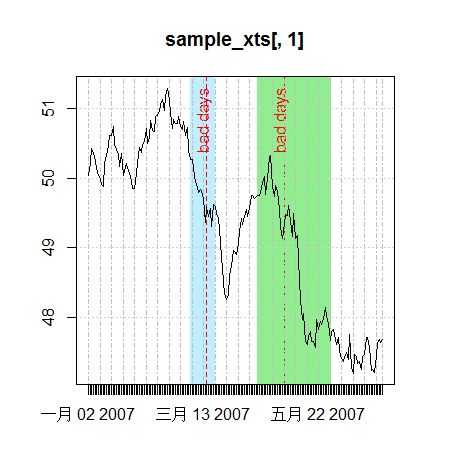
7). 双时间序列
双坐标视图
> plot(sample_xts[,1],sample_xts[,2])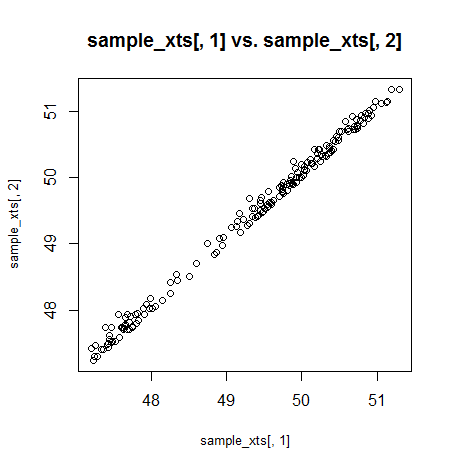
双坐标梯度视图
> cr <- colorRampPalette(c("#00FF00","#FF0000"))> plot(sample_xts[,1],sample_xts[,2], xy.labels = FALSE, xy.lines = TRUE, col = cr(NROW(sample_xts)), type = "l")
8). xts类型转换作图
ts类型作图
> tser <- ts(cumsum(rnorm(50, 0.05, 0.15)), start = 2007, frequency = 12)> class(tser)[1] "ts"> plot(tser)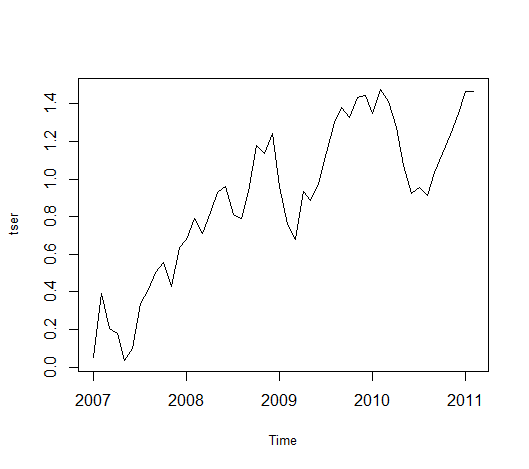
以xts类型作图
> plot.xts(tser)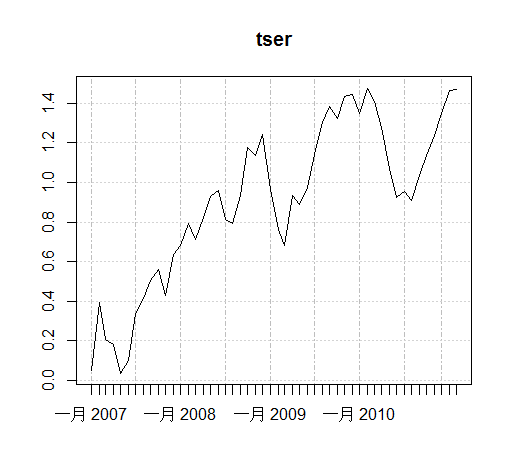
9). barplot
> x <- xts(matrix(abs(rnorm(72)), ncol = 6), Sys.Date() + 1:12)> colnames(x) <- LETTERS[1:6]> barplot(x)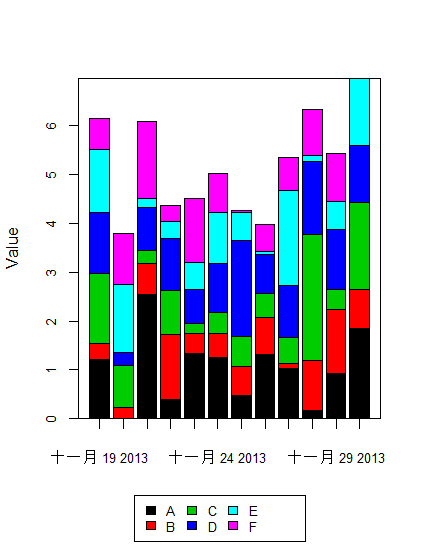
我们看到xtsExtra::plot.xts提供了强大的作图功能,很容易做出可视的时间序列!
转载请注明出处:
http://blog.fens.me/r-xts-xtsextra/
0 0
- plot.xts时间序列可视化
- R-xts()时间序列
- 时间序列基础包xts
- 可扩展的时间序列xts
- xts可扩展的时间序列
- R语言学习之<xts时间序列>
- 可扩展的时间序列xts
- plot.xts is wonderful
- R实战:【基本类型】可扩展时间序列类型xts(Extensible Time Series)
- matlab plot 可视化
- Matlab计算结果的可视化-plot绘图
- teqc plot file介绍及可视化软件
- R xts
- 使用R进行数据可视化套路之-散点图、图形分隔、时间序列
- 机器学习----Matlab数据可视化总结(plot篇)
- 【R语言】【可视化】 之 Mosaic Plot(马赛克图)
- Matlab数据的可视化 -- 线性图函数plot
- plot
- ecshop 认识及安装及安装中遇到的问题
- Android入门:ListView(SimpleAdapter实现)
- 敏捷设计(1)
- 自定义UITableViewCell
- ORACLE-基础五(online redo log)
- plot.xts时间序列可视化
- Windows下编译x264
- Android webkit 事件传递流程
- JavaWeb-14 (MySQL)
- Android内存管理机制
- 处理JSON:使用HttpMessageConverter
- IOS手势识别-UIGestureRecongnizer(swift)
- 【转】C# 上传本地文件至ftp上的方法
- 自增/自减学习