Improving performance – A full stack problem
来源:互联网 发布:桔子浏览器 知乎 编辑:程序博客网 时间:2024/05/29 10:09
Improving performance – A full stack problem
Improving the performance of a web system involves knowledge of how the entire technology stack operates and interacts. There are many simple and common tips that can provide immediate improvements for a website. Some examples include:
- Using a CDN for assets
- Compressing content
- Making fewer requests (web, cache, database)
- Asynchronous management
- Optimizing your SQL statements
- Have more memory
- Using SSD’s for database servers
- Updating your software versions
- Adding more servers
- Configuring your software correctly
- … And the general checklist goes on
Understanding where to invest your energy first, knowing what the return on investment can be, and most importantly the measurement and verification of every change made is the difference between blind trial and error and a solid plan and process. Here is a great example for the varied range of outcome to the point about “Updating your software versions”.
On one project the MySQL database was reaching saturation, both the maximum number of database connections and maximum number of concurrent InnoDB transactions. The first is a configurable limit, the second was a hard limit of the very old version of the software. Changing the first configurable limit can have dire consequences, there is a tipping point, however that is a different discussion. A simple software upgrade of MySQL which had many possible improvement benefits, combined with corrected configuration specific for this new version made an immediate improvement. The result moved a production system from crashing consistently under load, to at least barely surviving under load. This is an important first step in improving the customer experience.
In the PHP application stack for the same project the upgrading of several commonly used frameworks including Slim and Twig by the engineering department seemed like a good idea. However applicable load testing and profiling (after it was deployed, yet another discussion point) found the impact was a 30-40% increase in response time for the application layer. This made the system worse, and cancelled out prior work to improve the system.
How to tune a system to support 100x load increase with no impact in performance takes knowledge, experience, planning, testing and verification.
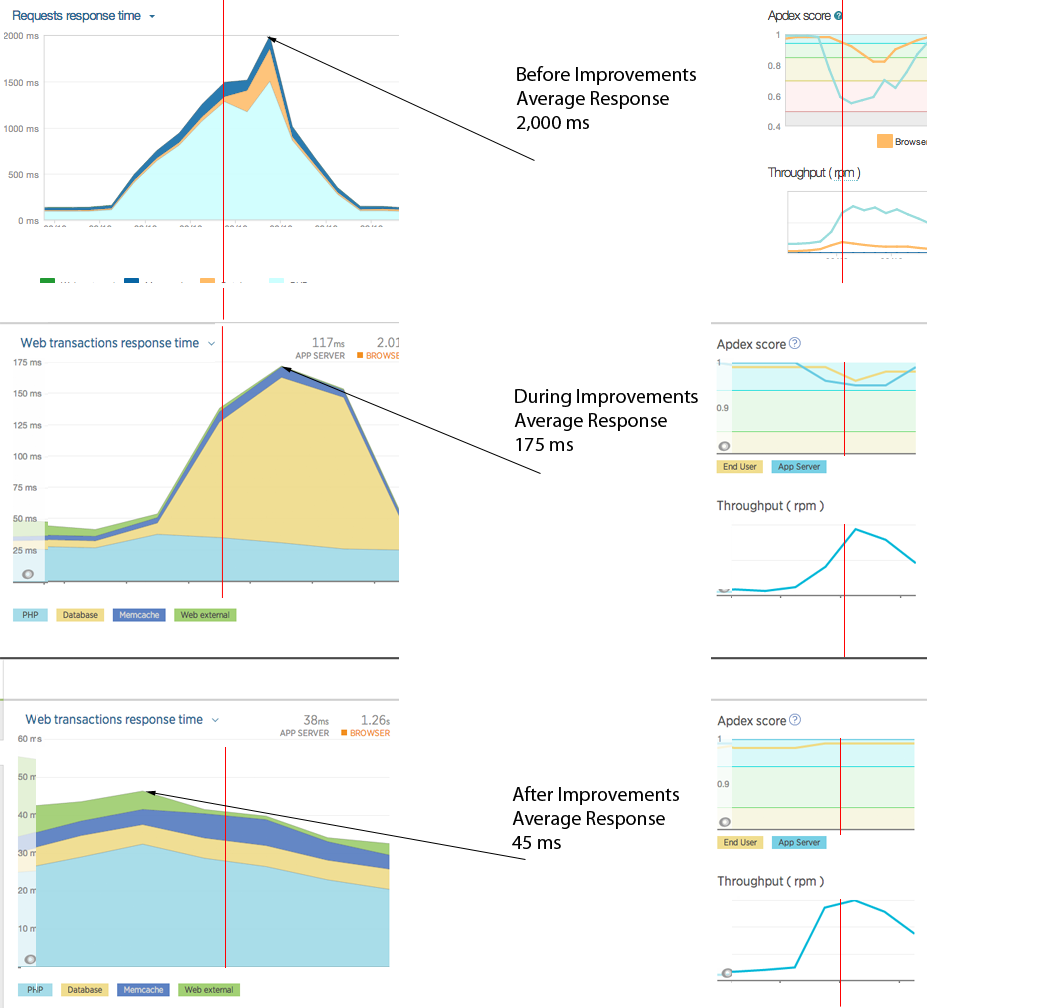
The following summarized graphs; using New Relic monitoring as a means of representative comparison; shows three snapshots of the average response time during various stages of full stack tuning and optimization. This is a very simplified graphical view that is supported by more detailed instrumentation using different products, specifically with much finer granularity of hundreds of metrics.
These graphs represent the work undertaken for a system under peak load showing an average 2,000ms response time, to the same workload under 50ms average response time. That is a 40x improvement!
If your organization can benefit from these types of improvements feel free toContact Me.
There are numerous steps to achieving this. A few highlights to show the scope of work you need to consider includes:
- Knowing server CPU saturation verses single core CPU saturation.
- Network latency detection and mitigation.
- What are the virtualization mode options of virtual cloud instances?
- Knowing the network stack benefits of different host operating systems.
- Simulating production load is much harder than it sounds.
- Profiling, Profiling, Profiling.
- Instrumentation can be misleading. Knowing how different monitoring works with sampling and averaging.
- Tuning the stack is an iterative process.
- The simple greatest knowledge is to know your code, your libraries, your dependencies and how to optimize each specific area of your technology stack.
- Not everything works, some expected wins provided no overall or observed benefits.
- There is always more that can be done. Knowing when to pause and prioritize process optimizations over system optimizations.
These graphs show the improvement work in the application tier (1500ms to 35ms to 25ms) and the database tier (500ms to 125ms to 10ms) at various stages. These graphs do not show for example improvements made in DNS resolution, different CDNs, managing static content, different types and ways of compression, remove unwanted software components and configuration, standardized and consistent stack deployments using chef, and even a reduction in overall servers. All of these successes contributed to a better and more consistent user experience.
src: http://ronaldbradford.com/blog/improving-performance-a-full-stack-problem-2015-03-06/
- Improving performance – A full stack problem
- Improving performance of reading text from a large text file
- Improving Web Services Performance
- Improving Performance for Wlan
- Improving SQL Server Performance
- improving Gradle build performance
- Improving Layout Performance
- improving sql server performance
- What is a Full Stack developer?
- What is a Full Stack developer?
- What is a Full Stack developer?
- What is a Full Stack developer?
- Improving Database Performance with Partitioning
- Improving (network) I/O performance
- Improving Snort performance with Barnyard
- 7 TIPS ON HOW TO BECOME A FULL STACK DEVELOPER!
- reSIProcate is a high performance, object-oriented, C++ sip stack
- Chapter 10 —Improving Web Services Performance
- java基础——静态代码块、构造代码块、构造函数执行顺序
- JSON数据格式学习笔记
- CharSequence和String的区别
- HDU ACM 2504 又见GCD
- P123 第29题 随机数
- Improving performance – A full stack problem
- 概率规划和贝叶斯方法
- android下的图片下载方法
- 《软件开发者路线图-从学徒到高手》读书笔记
- php统计在线人数
- ANDROID自定义视图——onMeasure流程,MeasureSpec详解
- C++中 #ifndef #define #endif的作用
- Autolayout的本质原理
- ZOJ Problem Set - 3876||May Day Holiday