Jfreechart
来源:互联网 发布:淘宝特卖品牌女装 编辑:程序博客网 时间:2024/06/05 23:04
转载: http://www.oschina.net/code/snippet_855019_36505
摘要 包括JfreeChart 中文API, JfreeChart开发中需要注意的问题, JfreeChart美化,使用JfreeChart创建柱状图,折线图,饼图,堆积柱状图,时间序列图,二维Y轴坐标图
Jfreechart chart 图表
目录[-]
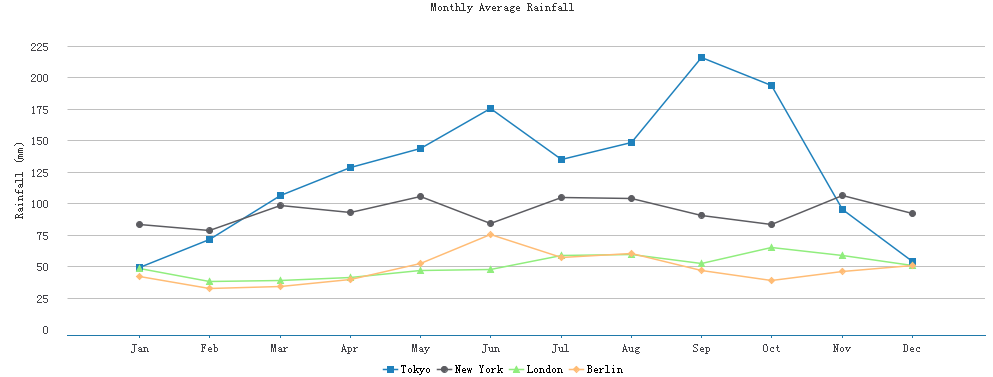
要想绘制出漂亮的图表,就必须了解图表的构成部分,将图表进行分解成N个部分。
然后再对每一个部分进行渲染,设置样式:包括背景色、轮廓线条样式和颜色、填充颜色、字体大小、样式、颜色。
同时,需要确保在整个项目中,图表的样式风格整体统一。
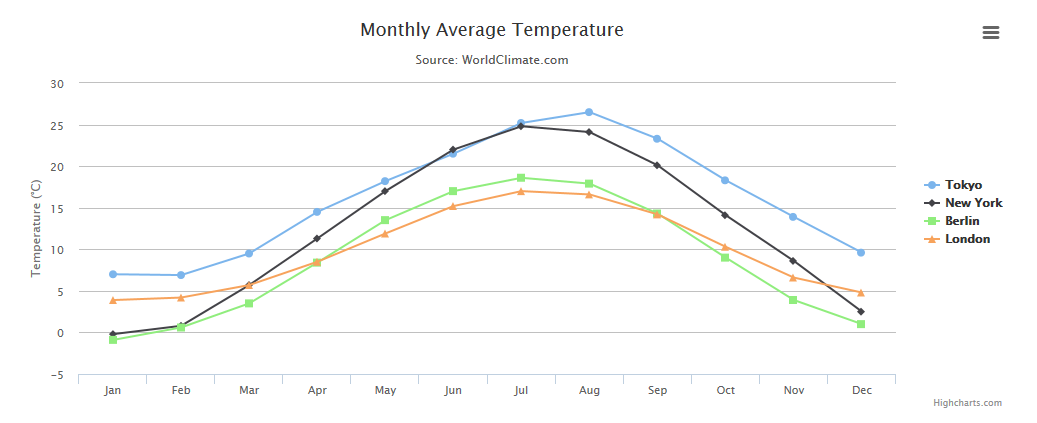
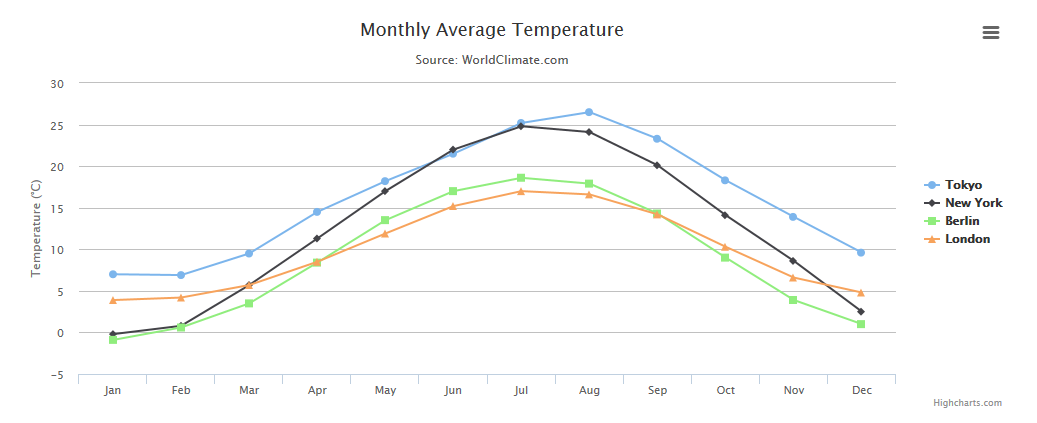
在来看看Highchart图表,对比一下,有木有觉得很像啊!
然后再对每一个部分进行渲染,设置样式:包括背景色、轮廓线条样式和颜色、填充颜色、字体大小、样式、颜色。
同时,需要确保在整个项目中,图表的样式风格整体统一。
统一,和谐才能打造漂亮、干净、专业的外观.
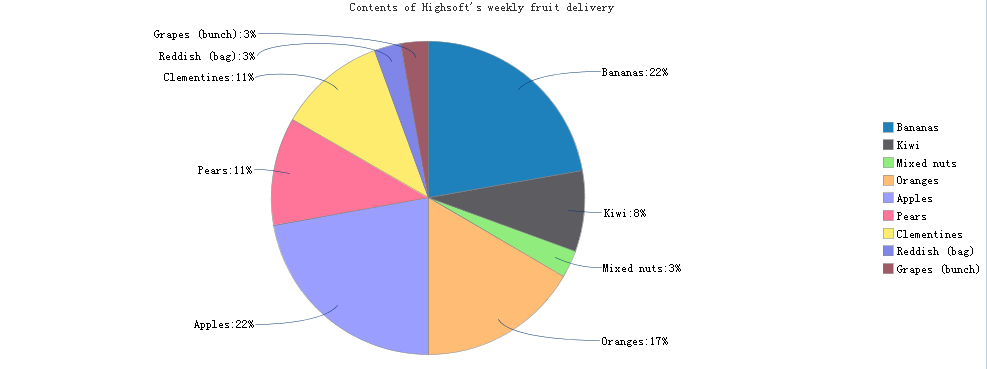
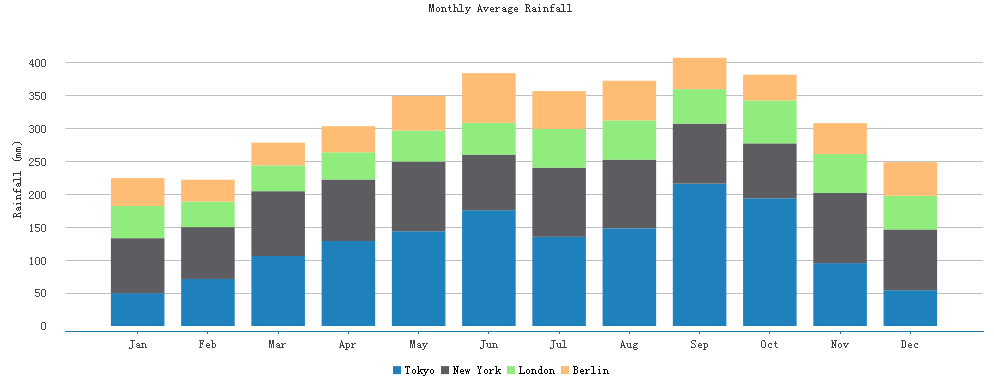
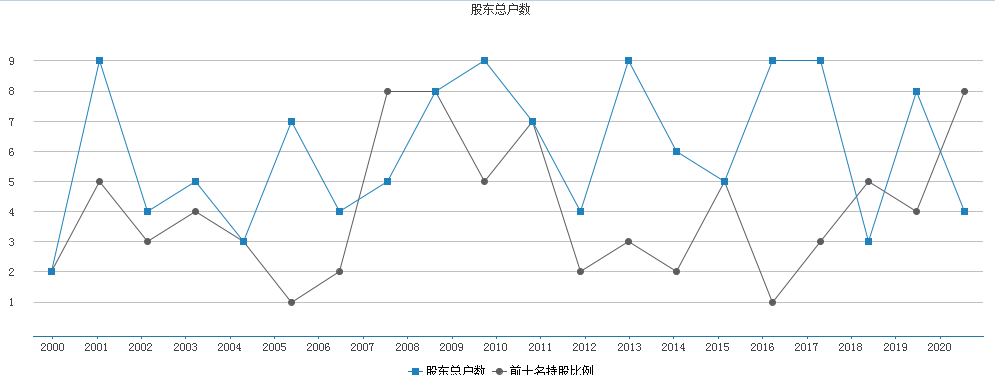
使用JfreeChart创建柱状图,折线图,饼图,堆积柱状图,时间序列图,二维Y轴坐标图.自己把自己整理的所有笔记和代码全都分享出来,希望大家在做图表的时候,不至于因为JfreeChart丑就不采用,学习Swing需要想象力....
代码太多了,项目代码地址:http://www.oschina.net/code/snippet_855019_36505
Jfreechart API详解和开发中大家所经常遇到的问题博客地址:http://my.oschina.net/abian/blog/278465
其他问题随时@我 因为马上就不做Swing了,所以自己还是为Swing留一点东西把
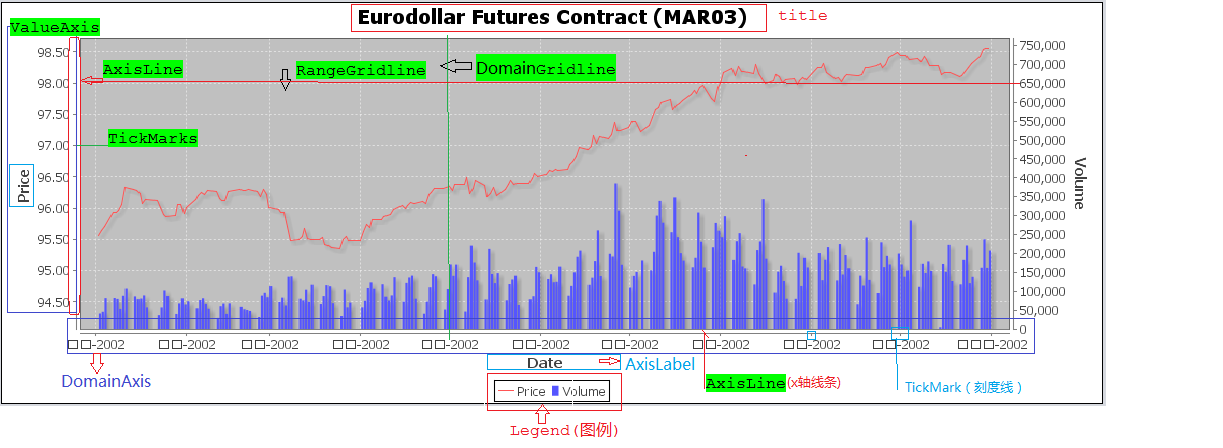
来一张最原始的Jfreechart图形吧!这界面,就和Swing一样,把大家都下跑啦!太丑陋不堪了,哈哈 !
但是呢,只要你肯下功夫,不要被第一感觉所欺骗!你看到的,不一定是真实的,只是因为我们都太懒!
最原始的图表属性拆解图:
美化后,Jfreechart图形效果展示:
柱状图界面:
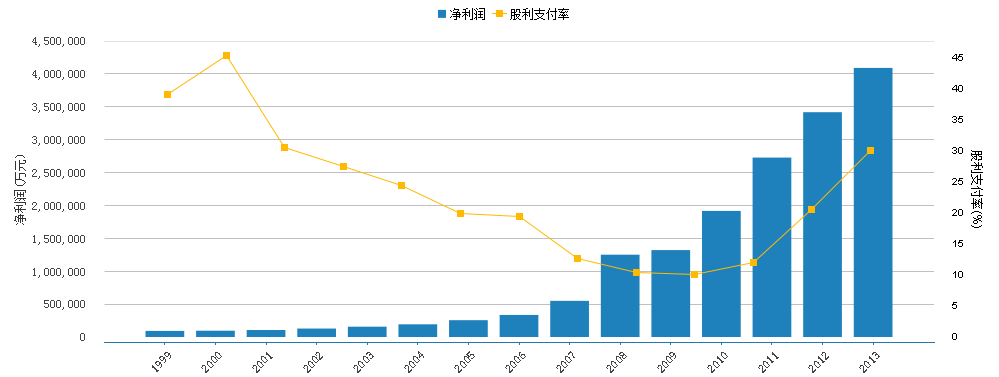
代码:这是我封装的工具类,然后绘制图表就非常简单了,而且美观专业!
?
1
2
3
4
5
6
7
8
9
10
11
12
13
14
15
16
17
18
19
20
21
22
23
24
25
26
27
28
29
30
31
32
33
34
35
36
37
38
39
40
41
42
43
44
45
46
47
48
49
50
51
52
53
54
55
56
57
58
59
60
61
62
63
64
65
66
67
68
69
70
71
72
73
74
75
76
77
78
79
80
81
82
83
84
85
86
87
88
89
90
91
92
93
94
95
96
97
98
99
100
101
102
103
104
105
106
107
108
109
110
111
112
113
114
115
116
117
118
119
120
121
122
123
124
125
126
127
128
129
130
131
132
133
134
135
136
137
138
139
140
141
142
143
144
145
146
147
148
149
150
151
152
153
154
155
156
157
158
159
160
161
162
163
164
165
166
167
168
169
170
171
172
173
174
175
176
177
178
179
180
181
182
183
184
185
186
187
188
189
190
191
192
193
194
195
196
197
198
199
200
201
202
203
204
205
206
207
208
209
210
211
212
213
214
215
216
217
218
219
220
221
222
223
224
225
226
227
228
229
230
231
232
233
234
235
236
237
238
239
240
241
242
243
244
245
246
247
248
249
250
251
252
253
254
255
256
257
258
259
260
261
262
263
264
265
266
267
268
269
270
271
272
273
274
275
276
277
278
279
280
281
282
283
284
285
286
287
288
289
290
291
292
293
294
295
296
297
298
299
300
301
302
303
304
305
306
307
308
309
310
311
312
313
314
315
316
317
318
319
320
321
322
323
324
325
326
327
328
329
330
331
332
333
334
335
336
337
338
339
340
341
342
343
344
345
346
347
348
349
350
351
352
353
354
355
356
357
358
359
360
361
362
363
364
365
366
367
368
369
370
371
372
373
374
375
376
377
378
379
380
381
382
383
384
385
386
387
388
389
390
391
392
393
394
395
396
397
398
399
400
401
402
403
404
405
406
407
408
409
410
411
412
413
414
415
416
417
418
419
420
421
422
423
424
425
426
427
428
429
430
431
432
433
434
435
436
437
438
439
440
441
442
443
444
445
446
447
448
449
450
451
452
453
454
455
456
457
458
459
460
461
462
463
464
465
466
467
468
469
470
471
472
473
474
475
476
477
478
479
480
481
482
483
484
485
486
487
488
packageutil;importjava.awt.BasicStroke;importjava.awt.Color;importjava.awt.Font;importjava.awt.Paint;importjava.awt.Rectangle;importjava.text.DecimalFormat;importjava.text.NumberFormat;importjava.text.ParseException;importjava.text.SimpleDateFormat;importjava.util.Date;importjava.util.Vector;importorg.jfree.chart.ChartFactory;importorg.jfree.chart.JFreeChart;importorg.jfree.chart.StandardChartTheme;importorg.jfree.chart.axis.DateAxis;importorg.jfree.chart.axis.DateTickUnit;importorg.jfree.chart.axis.DateTickUnitType;importorg.jfree.chart.axis.ValueAxis;importorg.jfree.chart.block.BlockBorder;importorg.jfree.chart.labels.ItemLabelAnchor;importorg.jfree.chart.labels.ItemLabelPosition;importorg.jfree.chart.labels.StandardCategoryItemLabelGenerator;importorg.jfree.chart.labels.StandardPieSectionLabelGenerator;importorg.jfree.chart.labels.StandardXYItemLabelGenerator;importorg.jfree.chart.labels.StandardXYToolTipGenerator;importorg.jfree.chart.plot.CategoryPlot;importorg.jfree.chart.plot.DefaultDrawingSupplier;importorg.jfree.chart.plot.PieLabelLinkStyle;importorg.jfree.chart.plot.PiePlot;importorg.jfree.chart.plot.Plot;importorg.jfree.chart.plot.XYPlot;importorg.jfree.chart.renderer.category.BarRenderer;importorg.jfree.chart.renderer.category.LineAndShapeRenderer;importorg.jfree.chart.renderer.category.StackedBarRenderer;importorg.jfree.chart.renderer.category.StandardBarPainter;importorg.jfree.chart.renderer.xy.StandardXYBarPainter;importorg.jfree.chart.renderer.xy.XYBarRenderer;importorg.jfree.chart.renderer.xy.XYLineAndShapeRenderer;importorg.jfree.data.category.DefaultCategoryDataset;importorg.jfree.data.general.DefaultPieDataset;importorg.jfree.data.time.Day;importorg.jfree.data.time.TimeSeries;importorg.jfree.ui.RectangleInsets;importorg.jfree.ui.TextAnchor;/** * Jfreechart工具类 * <p> * 解决中午乱码问题<br> * 用来创建类别图表数据集、创建饼图数据集、时间序列图数据集<br> * 用来对柱状图、折线图、饼图、堆积柱状图、时间序列图的样式进行渲染<br> * 设置X-Y坐标轴样式 * <p> * * * @author chenchangwen * @since:2014-2-18 * */publicclass ChartUtils { privatestatic String NO_DATA_MSG = "数据加载失败"; privatestatic Font FONT = newFont("宋体", Font.PLAIN, 12); publicstatic Color[] CHART_COLORS = { newColor(31,129,188),newColor(92,92,97),newColor(144,237,125),newColor(255,188,117), newColor(153,158,255),newColor(255,117,153),newColor(253,236,109),newColor(128,133,232), newColor(158,90,102),newColor(255,204,102) };// 颜色 static{ setChartTheme(); } publicChartUtils() { } /** * 中文主题样式 解决乱码 */ publicstatic void setChartTheme() { // 设置中文主题样式 解决乱码 StandardChartTheme chartTheme = newStandardChartTheme("CN"); // 设置标题字体 chartTheme.setExtraLargeFont(FONT); // 设置图例的字体 chartTheme.setRegularFont(FONT); // 设置轴向的字体 chartTheme.setLargeFont(FONT); chartTheme.setSmallFont(FONT); chartTheme.setTitlePaint(newColor(51,51,51)); chartTheme.setSubtitlePaint(newColor(85,85,85)); chartTheme.setLegendBackgroundPaint(Color.WHITE);// 设置标注 chartTheme.setLegendItemPaint(Color.BLACK);// chartTheme.setChartBackgroundPaint(Color.WHITE); // 绘制颜色绘制颜色.轮廓供应商 // paintSequence,outlinePaintSequence,strokeSequence,outlineStrokeSequence,shapeSequence Paint[] OUTLINE_PAINT_SEQUENCE = newPaint[] { Color.WHITE }; // 绘制器颜色源 DefaultDrawingSupplier drawingSupplier = newDefaultDrawingSupplier(CHART_COLORS, CHART_COLORS, OUTLINE_PAINT_SEQUENCE, DefaultDrawingSupplier.DEFAULT_STROKE_SEQUENCE, DefaultDrawingSupplier.DEFAULT_OUTLINE_STROKE_SEQUENCE, DefaultDrawingSupplier.DEFAULT_SHAPE_SEQUENCE); chartTheme.setDrawingSupplier(drawingSupplier); chartTheme.setPlotBackgroundPaint(Color.WHITE);// 绘制区域 chartTheme.setPlotOutlinePaint(Color.WHITE);// 绘制区域外边框 chartTheme.setLabelLinkPaint(newColor(8,55,114));// 链接标签颜色 chartTheme.setLabelLinkStyle(PieLabelLinkStyle.CUBIC_CURVE); chartTheme.setAxisOffset(newRectangleInsets(5,12,5,12)); chartTheme.setDomainGridlinePaint(newColor(192,208,224));// X坐标轴垂直网格颜色 chartTheme.setRangeGridlinePaint(newColor(192,192,192));// Y坐标轴水平网格颜色 chartTheme.setBaselinePaint(Color.WHITE); chartTheme.setCrosshairPaint(Color.BLUE);// 不确定含义 chartTheme.setAxisLabelPaint(newColor(51,51,51));// 坐标轴标题文字颜色 chartTheme.setTickLabelPaint(newColor(67,67,72));// 刻度数字 chartTheme.setBarPainter(newStandardBarPainter());// 设置柱状图渲染 chartTheme.setXYBarPainter(newStandardXYBarPainter());// XYBar 渲染 chartTheme.setItemLabelPaint(Color.black); chartTheme.setThermometerPaint(Color.white);// 温度计 ChartFactory.setChartTheme(chartTheme); } /** * 必须设置文本抗锯齿 */ publicstatic void setAntiAlias(JFreeChart chart) { chart.setTextAntiAlias(false); } /** * 设置图例无边框,默认黑色边框 */ publicstatic void setLegendEmptyBorder(JFreeChart chart) { chart.getLegend().setFrame(newBlockBorder(Color.WHITE)); } /** * 创建类别数据集合 */ publicstatic DefaultCategoryDataset createDefaultCategoryDataset(Vector<Serie> series, String[] categories) { DefaultCategoryDataset dataset = newDefaultCategoryDataset(); for(Serie serie : series) { String name = serie.getName(); Vector<Object> data = serie.getData(); if(data != null&& categories != null&& data.size() == categories.length) { for(intindex = 0; index < data.size(); index++) { String value = data.get(index) == null? "": data.get(index).toString(); if(isPercent(value)) { value = value.substring(0, value.length() - 1); } if(isNumber(value)) { dataset.setValue(Double.parseDouble(value), name, categories[index]); } } } } returndataset; } /** * 创建饼图数据集合 */ publicstatic DefaultPieDataset createDefaultPieDataset(String[] categories, Object[] datas) { DefaultPieDataset dataset = newDefaultPieDataset(); for(inti = 0; i < categories.length && categories != null; i++) { String value = datas[i].toString(); if(isPercent(value)) { value = value.substring(0, value.length() - 1); } if(isNumber(value)) { dataset.setValue(categories[i], Double.valueOf(value)); } } returndataset; } /** * 创建时间序列数据 * * @param category * 类别 * @param dateValues * 日期-值 数组 * @param xAxisTitle * X坐标轴标题 * @return */ publicstatic TimeSeries createTimeseries(String category, Vector<Object[]> dateValues) { TimeSeries timeseries = newTimeSeries(category); if(dateValues != null) { SimpleDateFormat dateFormat = newSimpleDateFormat("yyyy-MM-dd"); for(Object[] objects : dateValues) { Date date = null; try{ date = dateFormat.parse(objects[0].toString()); }catch(ParseException e) { } String sValue = objects[1].toString(); doubledValue = 0; if(date != null&& isNumber(sValue)) { dValue = Double.parseDouble(sValue); timeseries.add(newDay(date), dValue); } } } returntimeseries; } /** * 设置 折线图样式 * * @param plot * @param isShowDataLabels * 是否显示数据标签 默认不显示节点形状 */ publicstatic void setLineRender(CategoryPlot plot, booleanisShowDataLabels) { setLineRender(plot, isShowDataLabels, false); } /** * 设置折线图样式 * * @param plot * @param isShowDataLabels * 是否显示数据标签 */ publicstatic void setLineRender(CategoryPlot plot, booleanisShowDataLabels, booleanisShapesVisible) { plot.setNoDataMessage(NO_DATA_MSG); plot.setInsets(newRectangleInsets(10,10,0,10),false); LineAndShapeRenderer renderer = (LineAndShapeRenderer) plot.getRenderer(); renderer.setStroke(newBasicStroke(1.5F)); if(isShowDataLabels) { renderer.setBaseItemLabelsVisible(true); renderer.setBaseItemLabelGenerator(newStandardCategoryItemLabelGenerator(StandardCategoryItemLabelGenerator.DEFAULT_LABEL_FORMAT_STRING, NumberFormat.getInstance())); renderer.setBasePositiveItemLabelPosition(newItemLabelPosition(ItemLabelAnchor.OUTSIDE1, TextAnchor.BOTTOM_CENTER));// weizhi } renderer.setBaseShapesVisible(isShapesVisible);// 数据点绘制形状 setXAixs(plot); setYAixs(plot); } /** * 设置时间序列图样式 * * @param plot * @param isShowData * 是否显示数据 * @param isShapesVisible * 是否显示数据节点形状 */ publicstatic void setTimeSeriesRender(Plot plot, booleanisShowData, booleanisShapesVisible) { XYPlot xyplot = (XYPlot) plot; xyplot.setNoDataMessage(NO_DATA_MSG); xyplot.setInsets(newRectangleInsets(10,10,5,10)); XYLineAndShapeRenderer xyRenderer = (XYLineAndShapeRenderer) xyplot.getRenderer(); xyRenderer.setBaseItemLabelGenerator(newStandardXYItemLabelGenerator()); xyRenderer.setBaseShapesVisible(false); if(isShowData) { xyRenderer.setBaseItemLabelsVisible(true); xyRenderer.setBaseItemLabelGenerator(newStandardXYItemLabelGenerator()); xyRenderer.setBasePositiveItemLabelPosition(newItemLabelPosition(ItemLabelAnchor.OUTSIDE1, TextAnchor.BOTTOM_CENTER));// weizhi } xyRenderer.setBaseShapesVisible(isShapesVisible);// 数据点绘制形状 DateAxis domainAxis = (DateAxis) xyplot.getDomainAxis(); domainAxis.setAutoTickUnitSelection(false); DateTickUnit dateTickUnit = newDateTickUnit(DateTickUnitType.YEAR, 1,newSimpleDateFormat("yyyy-MM"));// 第二个参数是时间轴间距 domainAxis.setTickUnit(dateTickUnit); StandardXYToolTipGenerator xyTooltipGenerator = newStandardXYToolTipGenerator("{1}:{2}",newSimpleDateFormat("yyyy-MM-dd"),newDecimalFormat("0")); xyRenderer.setBaseToolTipGenerator(xyTooltipGenerator); setXY_XAixs(xyplot); setXY_YAixs(xyplot); } /** * 设置时间序列图样式 -默认不显示数据节点形状 * * @param plot * @param isShowData * 是否显示数据 */ publicstatic void setTimeSeriesRender(Plot plot, booleanisShowData) { setTimeSeriesRender(plot, isShowData, false); } /** * 设置时间序列图渲染:但是存在一个问题:如果timeseries里面的日期是按照天组织, 那么柱子的宽度会非常小,和直线一样粗细 * * @param plot * @param isShowDataLabels */ publicstatic void setTimeSeriesBarRender(Plot plot, booleanisShowDataLabels) { XYPlot xyplot = (XYPlot) plot; xyplot.setNoDataMessage(NO_DATA_MSG); XYBarRenderer xyRenderer = newXYBarRenderer(0.1D); xyRenderer.setBaseItemLabelGenerator(newStandardXYItemLabelGenerator()); if(isShowDataLabels) { xyRenderer.setBaseItemLabelsVisible(true); xyRenderer.setBaseItemLabelGenerator(newStandardXYItemLabelGenerator()); } StandardXYToolTipGenerator xyTooltipGenerator = newStandardXYToolTipGenerator("{1}:{2}",newSimpleDateFormat("yyyy-MM-dd"),newDecimalFormat("0")); xyRenderer.setBaseToolTipGenerator(xyTooltipGenerator); setXY_XAixs(xyplot); setXY_YAixs(xyplot); } /** * 设置柱状图渲染 * * @param plot * @param isShowDataLabels */ publicstatic void setBarRenderer(CategoryPlot plot, booleanisShowDataLabels) { plot.setNoDataMessage(NO_DATA_MSG); plot.setInsets(newRectangleInsets(10,10,5,10)); BarRenderer renderer = (BarRenderer) plot.getRenderer(); renderer.setBaseItemLabelGenerator(newStandardCategoryItemLabelGenerator()); renderer.setMaximumBarWidth(0.075);// 设置柱子最大宽度 if(isShowDataLabels) { renderer.setBaseItemLabelsVisible(true); } setXAixs(plot); setYAixs(plot); } /** * 设置堆积柱状图渲染 * * @param plot */ publicstatic void setStackBarRender(CategoryPlot plot) { plot.setNoDataMessage(NO_DATA_MSG); plot.setInsets(newRectangleInsets(10,10,5,10)); StackedBarRenderer renderer = (StackedBarRenderer) plot.getRenderer(); renderer.setBaseItemLabelGenerator(newStandardCategoryItemLabelGenerator()); plot.setRenderer(renderer); setXAixs(plot); setYAixs(plot); } /** * 设置类别图表(CategoryPlot) X坐标轴线条颜色和样式 * * @param axis */ publicstatic void setXAixs(CategoryPlot plot) { Color lineColor = newColor(31,121,170); plot.getDomainAxis().setAxisLinePaint(lineColor);// X坐标轴颜色 plot.getDomainAxis().setTickMarkPaint(lineColor);// X坐标轴标记|竖线颜色 } /** * 设置类别图表(CategoryPlot) Y坐标轴线条颜色和样式 同时防止数据无法显示 * * @param axis */ publicstatic void setYAixs(CategoryPlot plot) { Color lineColor = newColor(192,208,224); ValueAxis axis = plot.getRangeAxis(); axis.setAxisLinePaint(lineColor);// Y坐标轴颜色 axis.setTickMarkPaint(lineColor);// Y坐标轴标记|竖线颜色 // 隐藏Y刻度 axis.setAxisLineVisible(false); axis.setTickMarksVisible(false); // Y轴网格线条 plot.setRangeGridlinePaint(newColor(192,192,192)); plot.setRangeGridlineStroke(newBasicStroke(1)); plot.getRangeAxis().setUpperMargin(0.1);// 设置顶部Y坐标轴间距,防止数据无法显示 plot.getRangeAxis().setLowerMargin(0.1);// 设置底部Y坐标轴间距 } /** * 设置XY图表(XYPlot) X坐标轴线条颜色和样式 * * @param axis */ publicstatic void setXY_XAixs(XYPlot plot) { Color lineColor = newColor(31,121,170); plot.getDomainAxis().setAxisLinePaint(lineColor);// X坐标轴颜色 plot.getDomainAxis().setTickMarkPaint(lineColor);// X坐标轴标记|竖线颜色 } /** * 设置XY图表(XYPlot) Y坐标轴线条颜色和样式 同时防止数据无法显示 * * @param axis */ publicstatic void setXY_YAixs(XYPlot plot) { Color lineColor = newColor(192,208,224); ValueAxis axis = plot.getRangeAxis(); axis.setAxisLinePaint(lineColor);// X坐标轴颜色 axis.setTickMarkPaint(lineColor);// X坐标轴标记|竖线颜色 // 隐藏Y刻度 axis.setAxisLineVisible(false); axis.setTickMarksVisible(false); // Y轴网格线条 plot.setRangeGridlinePaint(newColor(192,192,192)); plot.setRangeGridlineStroke(newBasicStroke(1)); plot.setDomainGridlinesVisible(false); plot.getRangeAxis().setUpperMargin(0.12);// 设置顶部Y坐标轴间距,防止数据无法显示 plot.getRangeAxis().setLowerMargin(0.12);// 设置底部Y坐标轴间距 } /** * 设置饼状图渲染 */ publicstatic void setPieRender(Plot plot) { plot.setNoDataMessage(NO_DATA_MSG); plot.setInsets(newRectangleInsets(10,10,5,10)); PiePlot piePlot = (PiePlot) plot; piePlot.setInsets(newRectangleInsets(0,0,0,0)); piePlot.setCircular(true);// 圆形 // piePlot.setSimpleLabels(true);// 简单标签 piePlot.setLabelGap(0.01); piePlot.setInteriorGap(0.05D); piePlot.setLegendItemShape(newRectangle(10,10));// 图例形状 piePlot.setIgnoreNullValues(true); piePlot.setLabelBackgroundPaint(null);// 去掉背景色 piePlot.setLabelShadowPaint(null);// 去掉阴影 piePlot.setLabelOutlinePaint(null);// 去掉边框 piePlot.setShadowPaint(null); // 0:category 1:value:2 :percentage piePlot.setLabelGenerator(newStandardPieSectionLabelGenerator("{0}:{2}"));// 显示标签数据 } /** * 是不是一个%形式的百分比 * * @param str * @return */ publicstatic boolean isPercent(String str) { returnstr != null? str.endsWith("%") && isNumber(str.substring(0, str.length() - 1)) : false; } /** * 是不是一个数字 * * @param str * @return */ publicstatic boolean isNumber(String str) { returnstr != null? str.matches("^[-+]?(([0-9]+)((([.]{0})([0-9]*))|(([.]{1})([0-9]+))))$") : false; }}Serie
?
1
2
3
4
5
6
7
8
9
10
11
12
13
14
15
16
17
18
19
20
21
22
23
24
25
26
27
28
29
30
31
32
33
34
35
36
37
38
39
40
41
42
43
44
45
46
47
48
49
50
51
52
53
54
55
56
57
58
59
60
61
62
63
64
65
66
67
68
69
70
71
72
73
packageutil;importjava.io.Serializable;importjava.util.Vector;/** * 系列:名字和数据集合 构成一条曲线</br> 可以将serie看作一根线或者一根柱子: * * <p> * 参照JS图表来描述数据:</br> series: [{ name: 'Tokyo', data: [7.0, 6.9, 9.5, 14.5] * },</br> { name: 'New York', data: [-0.2, 0.8, 5.7, 11.3} ]</br> * </p> * * @author ccw * @date 2014-6-4 */publicclass Serie implementsSerializable { privatestatic final long serialVersionUID = 1L; privateString name;// 名字 privateVector<Object> data;// 数据值 publicSerie() { } /** * * @param name * 名称(线条名称) * @param data * 数据(线条上的所有数据值) */ publicSerie(String name, Vector<Object> data) { this.name = name; this.data = data; } /** * * @param name * 名称(线条名称) * @param array * 数据(线条上的所有数据值) */ publicSerie(String name, Object[] array) { this.name = name; if(array != null) { data = newVector<Object>(array.length); for(inti = 0; i < array.length; i++) { data.add(array[i]); } } } publicString getName() { returnname; } publicvoid setName(String name) { this.name = name; } publicVector<Object> getData() { returndata; } publicvoid setData(Vector<Object> data) { this.data = data; }}?
1
有木有觉得swing和Java2D很强大啊,学好swing,需要想象力!
0 0
- JFreeChart
- JFreeChart
- JFreeChart
- JFreeChart
- JFreeChart
- JFreeChart
- JFreeChart
- jfreechart
- JFreeChart
- JFreeChart
- jfreechart
- jfreeChart
- jfreechart
- JFreeChart
- jfreechart
- JFreeChart
- JFreeChart
- jfreechart
- Read N Characters Given Read4算法详解
- AOP
- 首行缩进
- IE编程——读取IE窗口信息
- hadoop图像处理接口hipi
- Jfreechart
- chrome扩展——Postman
- plsql中文乱码,显示问号
- RememberMe(Shiro)
- AOP 续
- Android使用Intent一键分享图片文字到腾讯、新浪、开心、微信等
- 中文乱码解决方案
- 如何在IE浏览器中调用未签名ActiveX控件的设置方法
- 我的vimrc,留而利值(不定期更新)