jmeter之监听器
来源:互联网 发布:java友盟别名推送demo 编辑:程序博客网 时间:2024/06/06 00:03
come from:http://www.blogjava.net/qileilove/articles/410862.html
18.3.12 Aggregate Graph
The aggregate graph is similar to the aggregate report. The primary difference is the aggregate graph provides an easy way to generate bar graphs and save the graph as a PNG file.Control Panel
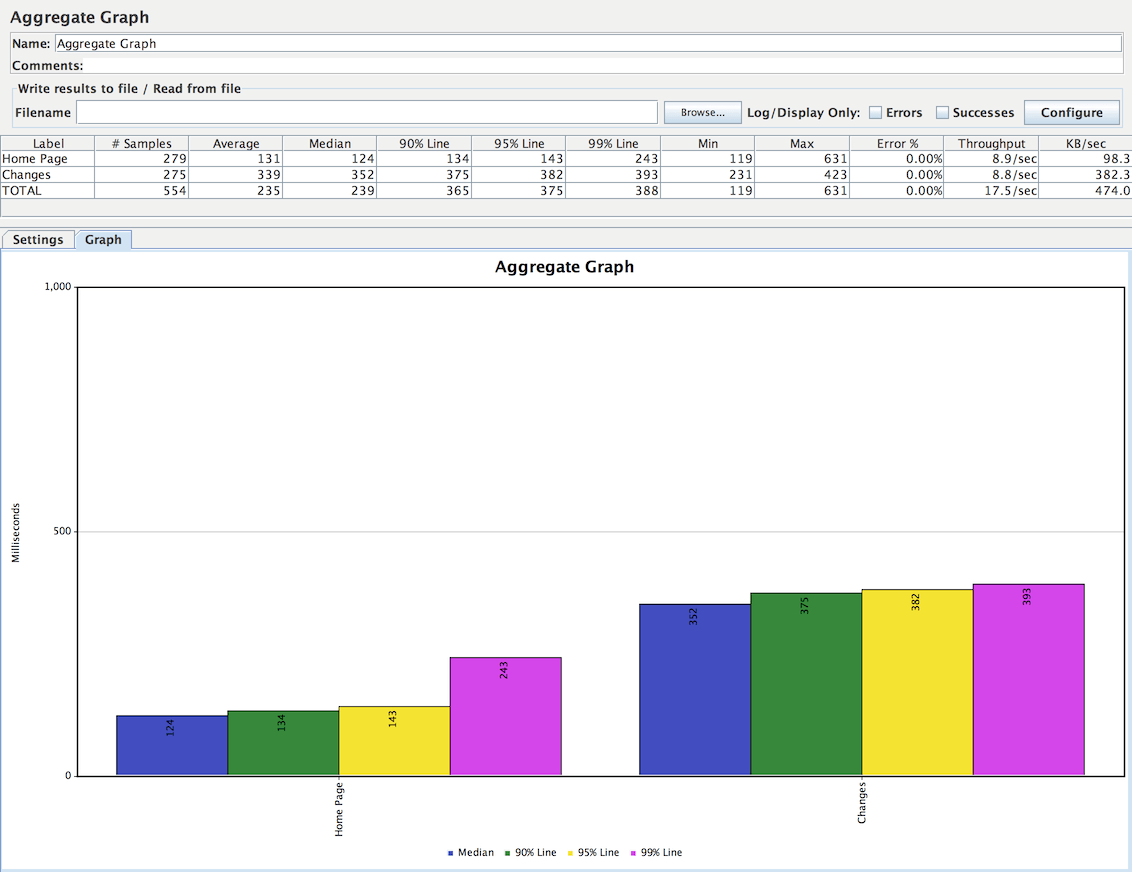
The figure below shows an example of settings to draw this graph.
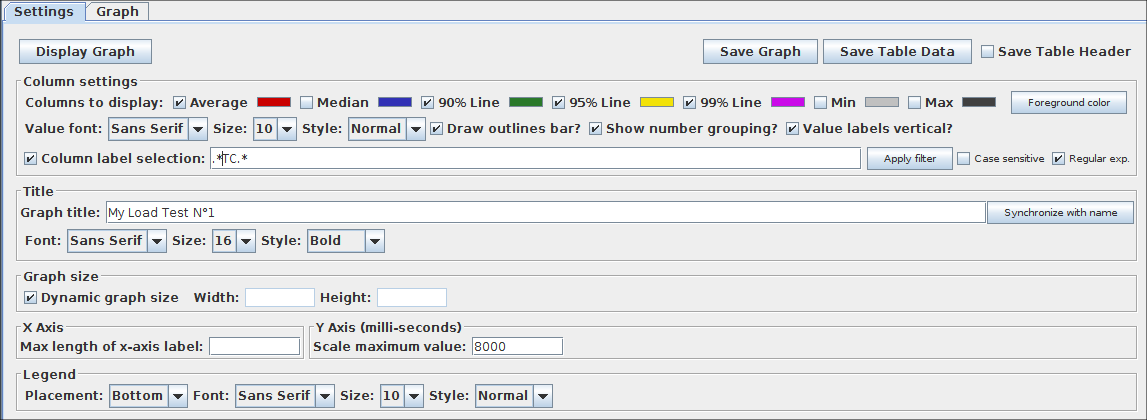
Aggregate graph settings
Please note: All this parameters aren't saved in JMeter jmx script.
Parameters
- Columns to display: Choose the column(s) to display in graph.
- Rectangles color: Clic on right color rectangle open a popup dialog to choose a custom color for column.
- Foreground color Allow to change the value text color.
- Value font: Allow to define font settings for the text.
- Draw outlines bar? To draw or not the border line on bar chart
- Show number grouping? Show or not the number grouping in Y Axis labels.
- Value labels vertical? Change orientation for value label. (Default is horizontal)
- Column label selection: Filter by result label. A regular expression can be used, example: .*Transaction.*
Before display the graph, click on Apply filter button to refresh internal data.
18.3.15 BeanShell Listener
The BeanShell Listener allows the use of BeanShell for processing samples for saving etc.
For full details on using BeanShell, please see the BeanShell website.
The test element supports the ThreadListener and TestListener methods. These should be defined in the initialisation file. See the file BeanShellListeners.bshrc for example definitions.
Control Panel
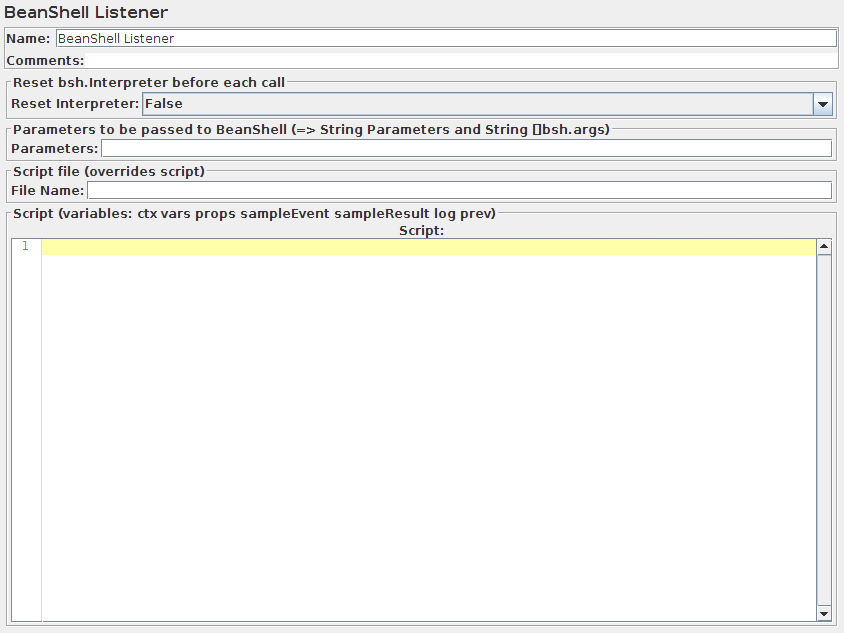
Parameters
- Parameters - string containing the parameters as a single variable
- bsh.args - String array containing parameters, split on white-space
Before invoking the script, some variables are set up in the BeanShell interpreter:
- log - (Logger) - can be used to write to the log file
- ctx - ( JMeterContext ) - gives access to the context
- vars - ( JMeterVariables ) - gives read/write access to variables: vars.get(key); vars.put(key,val); vars.putObject("OBJ1",new Object());
- props - (JMeterProperties - class java.util.Properties) - e.g. props.get("START.HMS"); props.put("PROP1","1234");
- sampleResult, prev - ( SampleResult ) - gives access to the previous SampleResult
- sampleEvent ( SampleEvent ) gives access to the current sample event
For details of all the methods available on each of the above variables, please check the Javadoc
If the property beanshell.listener.init is defined, this is used to load an initialisation file, which can be used to define methods etc for use in the BeanShell script.
18.3.18 BSF Listener
The BSF Listener allows BSF script code to be applied to sample results.
Control Panel
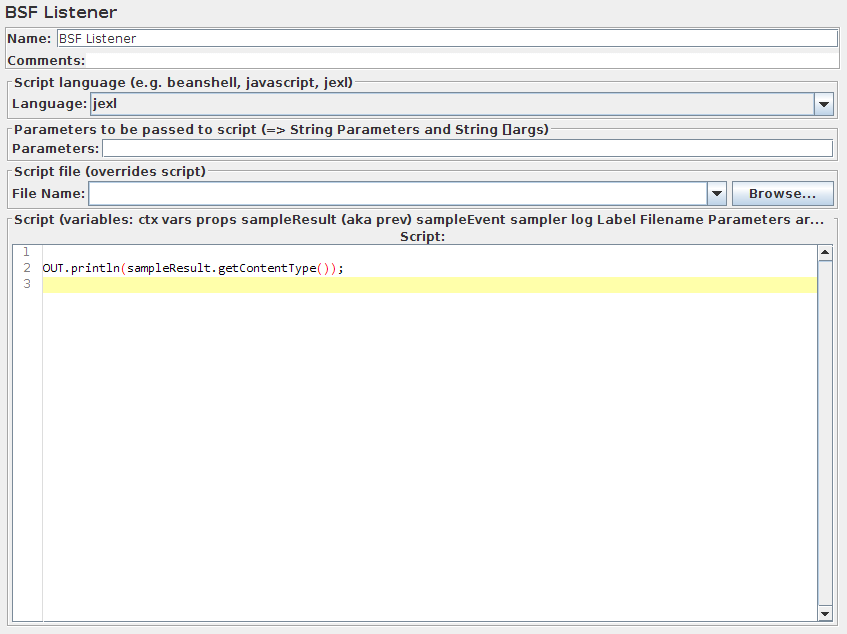
Parameters
- Parameters - string containing the parameters as a single variable
- args - String array containing parameters, split on white-space
The script (or file) is processed using the BSFEngine.exec() method, which does not return a value.
Before invoking the script, some variables are set up. Note that these are BSF variables - i.e. they can be used directly in the script.
- log - (Logger) - can be used to write to the log file
- Label - the String Label
- Filename - the script file name (if any)
- Parameters - the parameters (as a String)
- args[] - the parameters as a String array (split on whitespace)
- ctx - ( JMeterContext ) - gives access to the context
- vars - ( JMeterVariables ) - gives read/write access to variables: vars.get(key); vars.put(key,val); vars.putObject("OBJ1",new Object()); vars.getObject("OBJ2");
- props - (JMeterProperties - class java.util.Properties) - e.g. props.get("START.HMS"); props.put("PROP1","1234");
- sampleResult, prev - ( SampleResult ) - gives access to the SampleResult
- sampleEvent - ( SampleEvent ) - gives access to the SampleEvent
- sampler - (Sampler)- gives access to the last sampler
- OUT - System.out - e.g. OUT.println("message")
For details of all the methods available on each of the above variables, please check the Javadoc
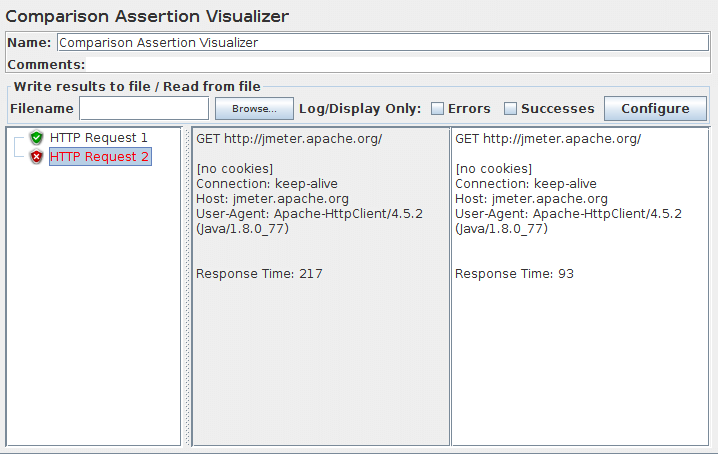
18.3.20 Comparison Assertion Visualizer
The Comparison Assertion Visualizer shows the results of any Compare Assertion elements.Control Panel
Parameters
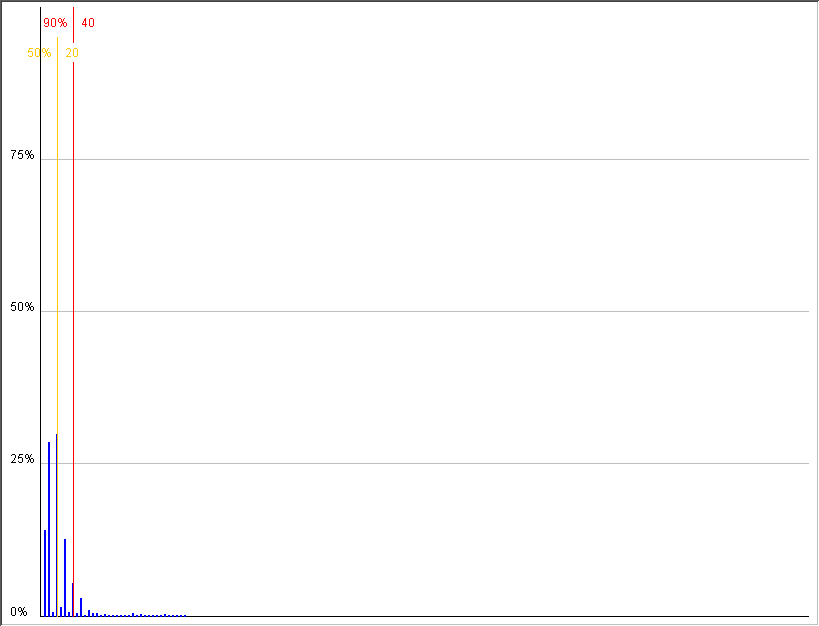
18.3.11 Distribution Graph (alpha)
Distribution Graph MUST NOT BE USED during load test as it consumes a lot of resources (memory and CPU). Use it only for either functional testing or during Test Plan debugging and Validation.
The distribution graph will display a bar for every unique response time. Since the granularity of System.currentTimeMillis() is 10 milliseconds, the 90% threshold should be within the width of the graph. The graph will draw two threshold lines: 50% and 90%. What this means is 50% of the response times finished between 0 and the line. The same is true of 90% line. Several tests with Tomcat were performed using 30 threads for 600K requests. The graph was able to display the distribution without any problems and both the 50% and 90% line were within the width of the graph. A performant application will generally produce results that clump together. A poorly written application that has memory leaks may result in wild fluctuations. In those situations, the threshold lines may be beyond the width of the graph. The recommended solution to this specific problem is fix the webapp so it performs well. If your test plan produces distribution graphs with no apparent clumping or pattern, it may indicate a memory leak. The only way to know for sure is to use a profiling tool.
Control Panel
18.3.13 Response Time Graph
The Response Time Graph draws a line chart showing the evolution of response time during the test, for each labelled request. If many samples exist for the same timestamp, the mean value is displayed.Control Panel
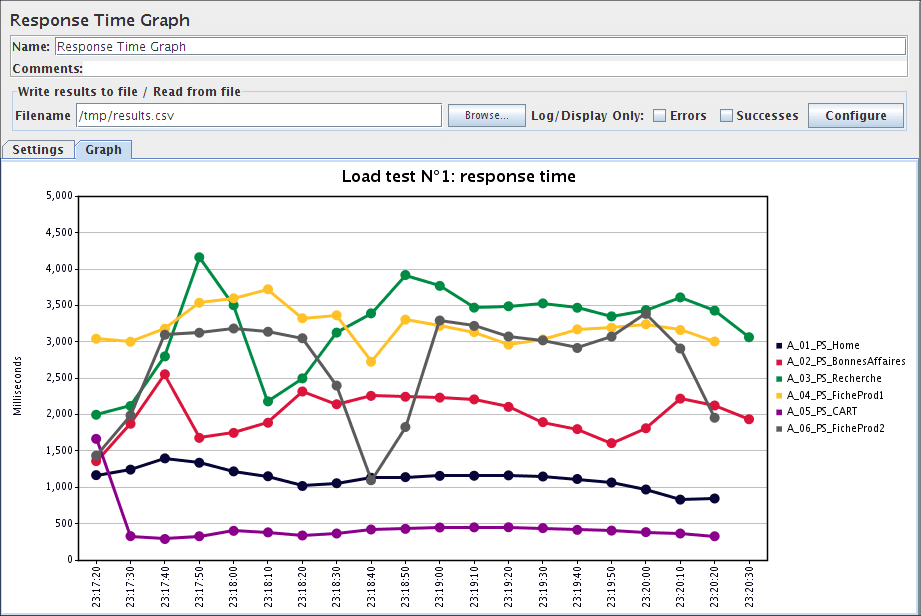
The figure below shows an example of settings to draw this graph.
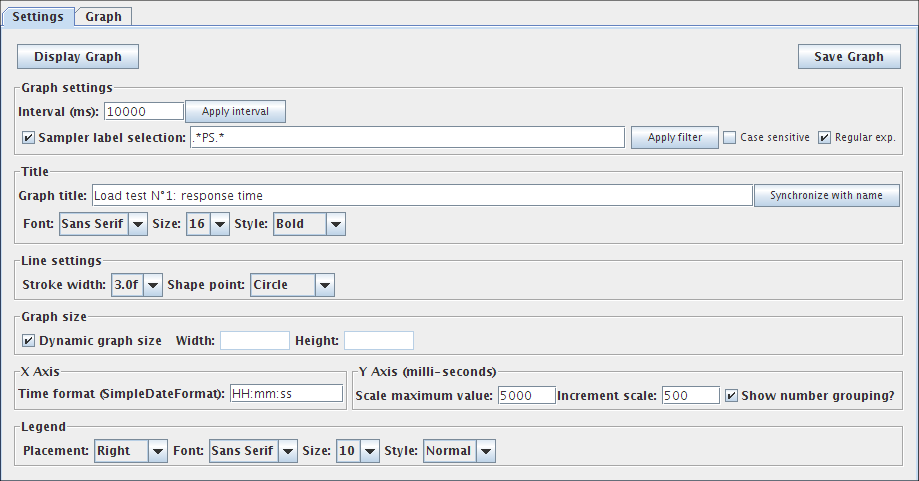
Response time graph settings
Please note: All this parameters aren't saved in JMeter jmx script.
Parameters
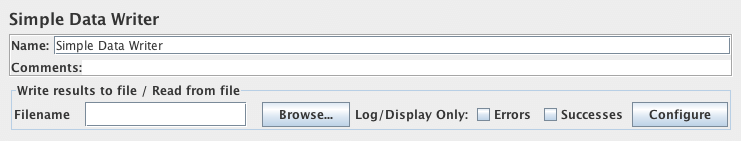
18.3.9 Simple Data Writer
This listener can record results to a file but not to the UI. It is meant to provide an efficient means of recording data by eliminating GUI overhead. When running in non-GUI mode, the -l flag can be used to create a data file. The fields to save are defined by JMeter properties. See the jmeter.properties file for details.Control Panel
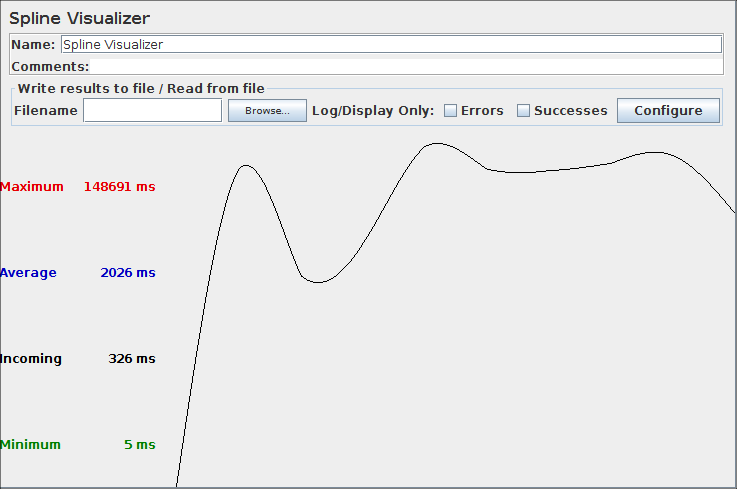
18.3.4 Spline Visualizer
Spline Visualizer MUST NOT BE USED during load test as it consumes a lot of resources (memory and CPU). Use it only for either functional testing or during Test Plan debugging and Validation.
The Spline Visualizer provides a view of all sample times from the start of the test till the end, regardless of how many samples have been taken. The spline has 10 points, each representing 10% of the samples, and connected using spline logic to show a single continuous line.
The graph is automatically scaled to fit within the window. This needs to be borne in mind when comparing graphs.
Control Panel
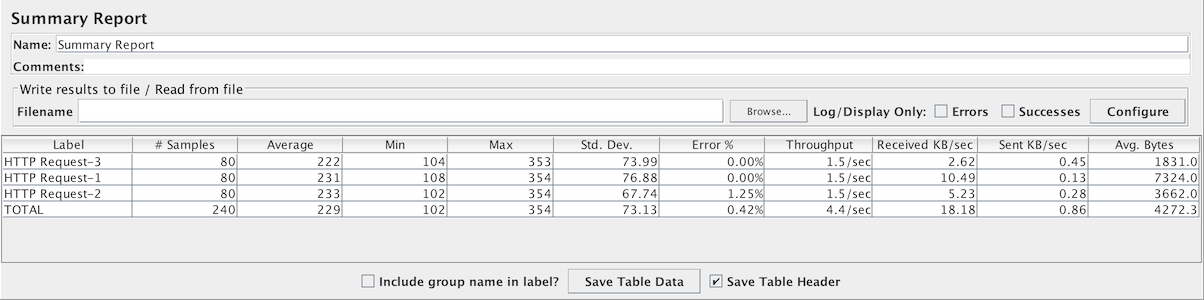
8.3.16 Summary Report
The summary report creates a table row for each differently named request in your test. This is similar to the Aggregate Report , except that it uses less memory.The thoughput is calculated from the point of view of the sampler target (e.g. the remote server in the case of HTTP samples). JMeter takes into account the total time over which the requests have been generated. If other samplers and timers are in the same thread, these will increase the total time, and therefore reduce the throughput value. So two identical samplers with different names will have half the throughput of two samplers with the same name. It is important to choose the sampler labels correctly to get the best results from the Report.
- Label - The label of the sample. If "Include group name in label?" is selected, then the name of the thread group is added as a prefix. This allows identical labels from different thread groups to be collated separately if required.
- # Samples - The number of samples with the same label
- Average - The average elapsed time of a set of results
- Min - The lowest elapsed time for the samples with the same label
- Max - The longest elapsed time for the samples with the same label
- Std. Dev. - the Standard Deviation of the sample elapsed time
- Error % - Percent of requests with errors
- Throughput - the Throughput is measured in requests per second/minute/hour. The time unit is chosen so that the displayed rate is at least 1.0. When the throughput is saved to a CSV file, it is expressed in requests/second, i.e. 30.0 requests/minute is saved as 0.5.
- Kb/sec - The throughput measured in Kilobytes per second
- Avg. Bytes - average size of the sample response in bytes. (in JMeter 2.2 it wrongly showed the value in kB)
Times are in milliseconds.
Control Panel
The figure below shows an example of selecting the "Include group name" checkbox.
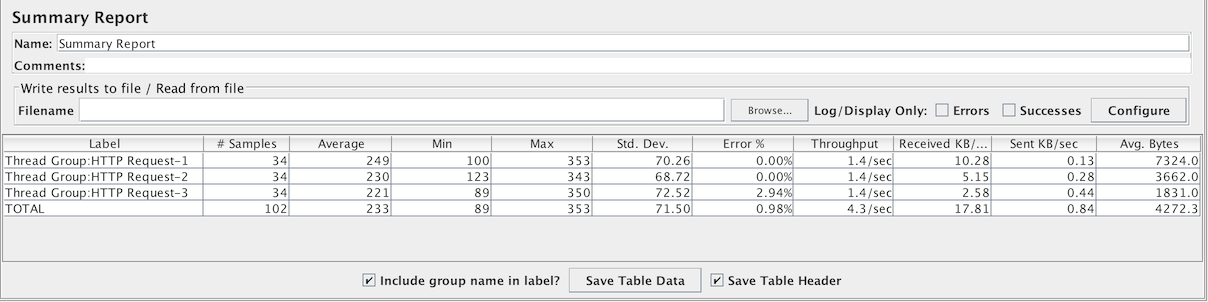
Sample "Include group name" display
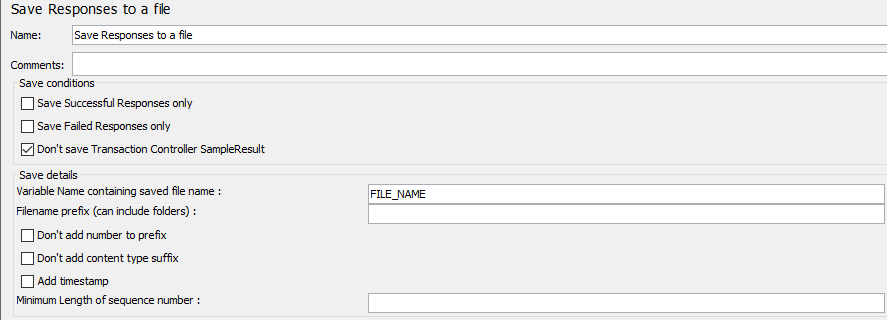
18.3.17 Save Responses to a file
This test element can be placed anywhere in the test plan. For each sample in its scope, it will create a file of the response Data. The primary use for this is in creating functional tests, but it can also be useful where the response is too large to be displayed in the View Results Tree Listener. The file name is created from the specified prefix, plus a number (unless this is disabled, see below). The file extension is created from the document type, if known. If not known, the file extension is set to 'unknown'. If numbering is disabled, and adding a suffix is disabled, then the file prefix is taken as the entire file name. This allows a fixed file name to be generated if required. The generated file name is stored in the sample response, and can be saved in the test log output file if required.
The current sample is saved first, followed by any sub-samples (child samples). If a variable name is provided, then the names of the files are saved in the order that the sub-samples appear. See below.
Control Panel
Parameters
18.3.3 Graph Results
Graph Results MUST NOT BE USED during load test as it consumes a lot of resources (memory and CPU). Use it only for either functional testing or during Test Plan debugging and Validation.
The Graph Results listener generates a simple graph that plots all sample times. Along the bottom of the graph, the current sample (black), the current average of all samples(blue), the current standard deviation (red), and the current throughput rate (green) are displayed in milliseconds.
The throughput number represents the actual number of requests/minute the server handled. This calculation includes any delays you added to your test and JMeter's own internal processing time. The advantage of doing the calculation like this is that this number represents something real - your server in fact handled that many requests per minute, and you can increase the number of threads and/or decrease the delays to discover your server's maximum throughput. Whereas if you made calculations that factored out delays and JMeter's processing, it would be unclear what you could conclude from that number.
Control Panel
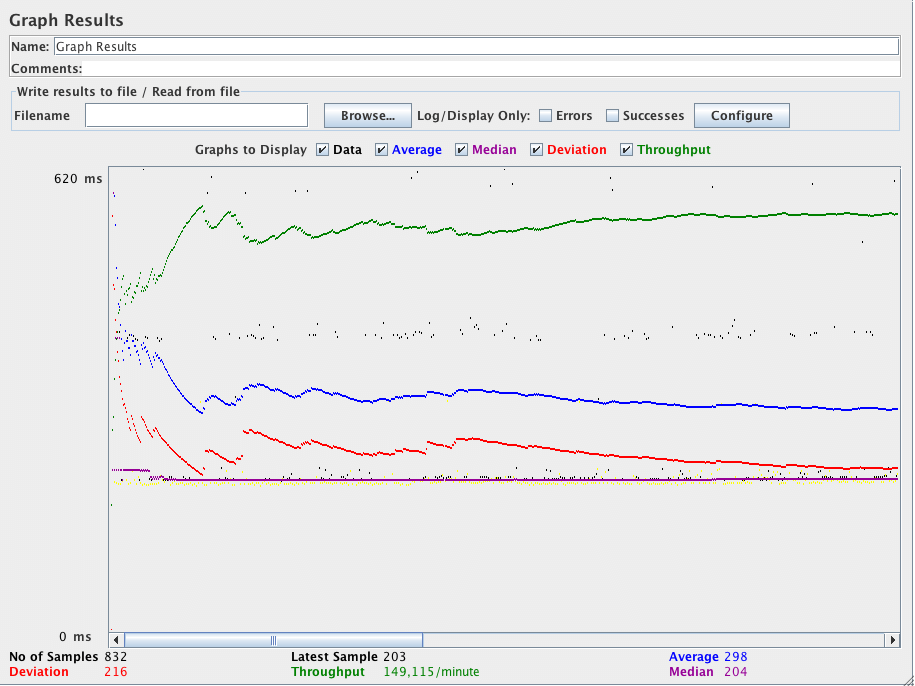
The following table briefly describes the items on the graph. Further details on the precise meaning of the statistical terms can be found on the web - e.g. Wikipedia - or by consulting a book on statistics.
- Data - plot the actual data values
- Average - plot the Average
- Median - plot the Median (midway value)
- Deviation - plot the Standard Deviation (a measure of the variation)
- Throughput - plot the number of samples per unit of time
The individual figures at the bottom of the display are the current values. "Latest Sample" is the current elapsed sample time, shown on the graph as "Data".
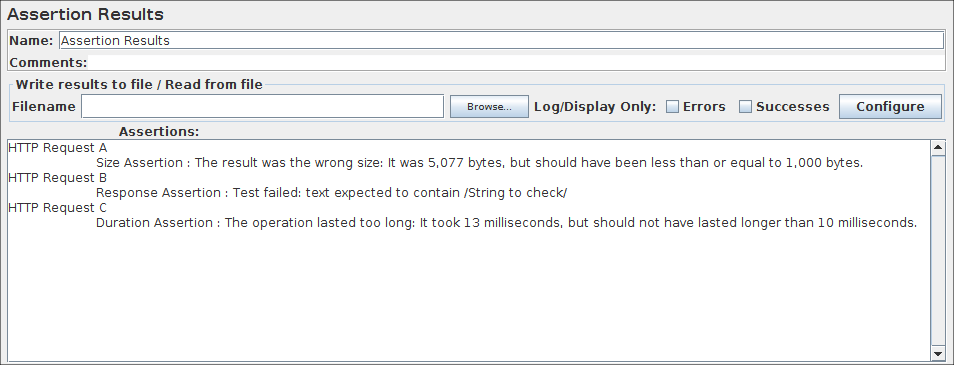
18.3.5 Assertion Results
Assertion Results MUST NOT BE USED during load test as it consumes a lot of resources (memory and CPU). Use it only for either functional testing or during Test Plan debugging and Validation.
The Assertion Results visualizer shows the Label of each sample taken. It also reports failures of any Assertions that are part of the test plan.
Control Panel
See Also:
- Response Assertion
18.3.19 Generate Summary Results
This test element can be placed anywhere in the test plan. Generates a summary of the test run so far to the log file and/or standard output. Both running and differential totals are shown. Output is generated every n seconds (default 3 minutes) on the appropriate time boundary, so that multiple test runs on the same time will be synchronised. See jmeter.properties file for the summariser configuration items:# Define the following property to automatically start a summariser with that name # (applies to non-GUI mode only) #summariser.name=summary # # interval between summaries (in seconds) default 3 minutes #summariser.interval=180 # # Write messages to log file #summariser.log=true # # Write messages to System.out #summariser.out=trueThis element is mainly intended for batch (non-GUI) runs. The output looks like the following:
label + 171 in 20.3s = 8.4/s Avg: 1129 Min: 1000 Max: 1250 Err: 0 (0.00%) label + 263 in 31.3s = 8.4/s Avg: 1138 Min: 1000 Max: 1250 Err: 0 (0.00%) label = 434 in 50.4s = 8.6/s Avg: 1135 Min: 1000 Max: 1250 Err: 0 (0.00%) label + 263 in 31.0s = 8.5/s Avg: 1138 Min: 1000 Max: 1250 Err: 0 (0.00%) label = 697 in 80.3s = 8.7/s Avg: 1136 Min: 1000 Max: 1250 Err: 0 (0.00%) label + 109 in 12.4s = 8.8/s Avg: 1092 Min: 47 Max: 1250 Err: 0 (0.00%) label = 806 in 91.6s = 8.8/s Avg: 1130 Min: 47 Max: 1250 Err: 0 (0.00%)The "label" is the the name of the element. The "+" means that the line is a delta line, i.e. shows the changes since the last output. The "=" means that the line is a totals line, i.e. it shows the running total. Entries in the jmeter log file also include time-stamps. The example "806 in 91.6s = 8.8/s" means that there were 806 samples recorded in 91.6 seconds, and that works out at 8.8 samples per second. The Avg (Average), Min(imum) and Max(imum) times are in milliseconds. "Err" means number of errors (also shown as percentage). The last two lines will appear at the end of a test. They will not be synchronised to the appropriate time boundary. Note that the initial and final deltas may be for less than the interval (in the example above this is 30 seconds). The first delta will generally be lower, as JMeter synchronises to the interval boundary. The last delta will be lower, as the test will generally not finish on an exact interval boundary.
The label is used to group sample results together. So if you have multiple Thread Groups and want to summarize across them all, then use the same label - or add the summariser to the Test Plan (so all thread groups are in scope). Different summary groupings can be implemented by using suitable labels and adding the summarisers to appropriate parts of the test plan.
Control Panel
Parameters
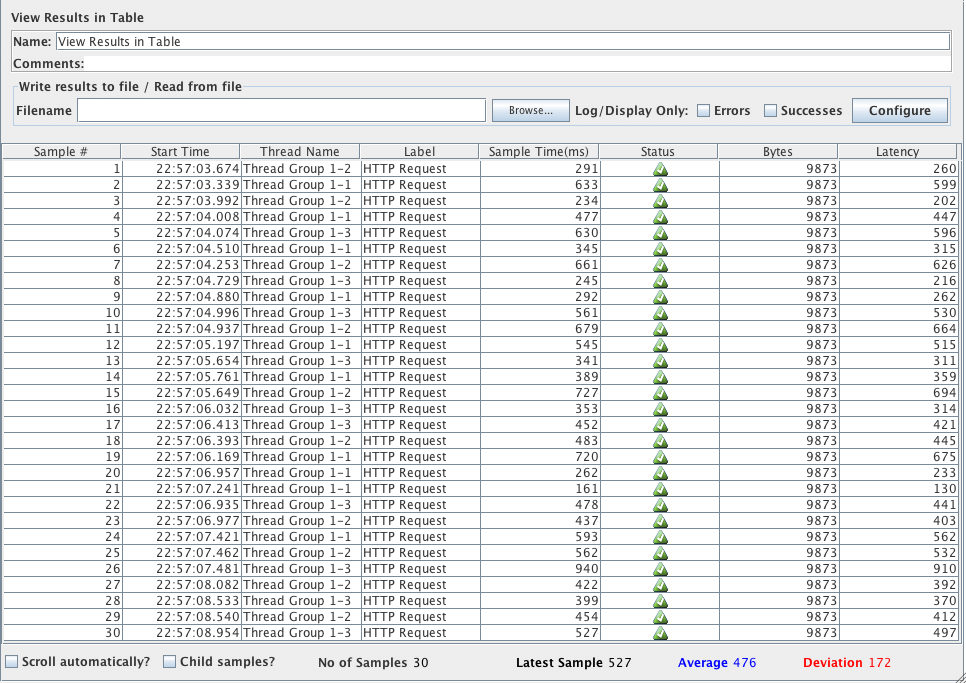
18.3.8 View Results in Table
This visualizer creates a row for every sample result. Like the View Results Tree , this visualizer uses a lot of memory.By default, it only displays the main (parent) samples; it does not display the sub-samples (child samples). Versions of JMeter after 2.5.1 have a "Child Samples?" check-box. If this is selected, then the sub-samples are displayed instead of the main samples.
Control Panel
18.3.10 Monitor Results
Monitor Results is a new Visualizer for displaying server status. It is designed for Tomcat 5, but any servlet container can port the status servlet and use this monitor. There are two primary tabs for the monitor. The first is the "Health" tab, which will show the status of one or more servers. The second tab labled "Performance" shows the performance for one server for the last 1000 samples. The equations used for the load calculation is included in the Visualizer.
Currently, the primary limitation of the monitor is system memory. A quick benchmark of memory usage indicates a buffer of 1000 data points for 100 servers would take roughly 10Mb of RAM. On a 1.4Ghz centrino laptop with 1Gb of ram, the monitor should be able to handle several hundred servers.
As a general rule, monitoring production systems should take care to set an appropriate interval. Intervals shorter than 5 seconds are too aggressive and have a potential of impacting the server. With a buffer of 1000 data points at 5 second intervals, the monitor would check the server status 12 times a minute or 720 times a hour. This means the buffer shows the performance history of each machine for the last hour.
The monitor requires Tomcat 5 or above. Use a browser to check that you can access the Tomcat status servlet OK.
For a detailed description of how to use the monitor, please refer to Building a Monitor Test Plan
Control Panel

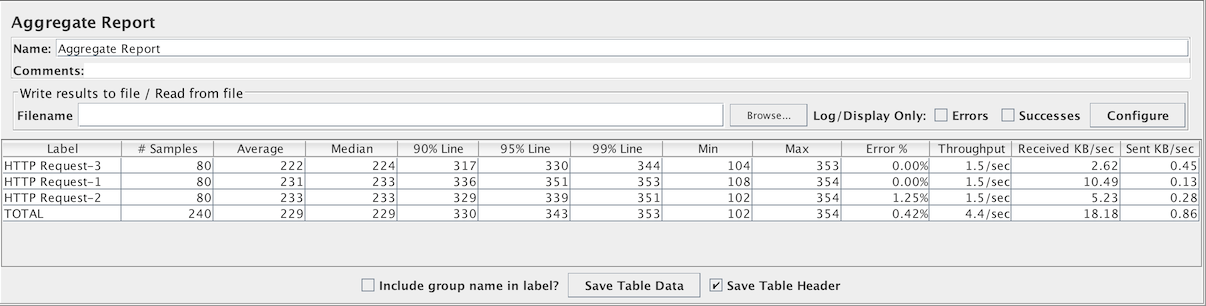
8.3.7 Aggregate Report
The aggregate report creates a table row for each differently named request in your test. For each request, it totals the response information and provides request count, min, max, average, error rate, approximate throughput (request/second) and Kilobytes per second throughput. Once the test is done, the throughput is the actual through for the duration of the entire test.The thoughput is calculated from the point of view of the sampler target (e.g. the remote server in the case of HTTP samples). JMeter takes into account the total time over which the requests have been generated. If other samplers and timers are in the same thread, these will increase the total time, and therefore reduce the throughput value. So two identical samplers with different names will have half the throughput of two samplers with the same name. It is important to choose the sampler names correctly to get the best results from the Aggregate Report.
Calculation of the Median and 90% Line (90 th percentile ) values requires additional memory. For JMeter 2.3.4 and earlier, details of each sample were saved separately, which meant a lot of memory was needed. JMeter now combines samples with the same elapsed time, so far less memory is used. However, for samples that take more than a few seconds, the probability is that fewer samples will have identical times, in which case more memory will be needed. See the Summary Report for a similar Listener that does not store individual samples and so needs constant memory.
- Label - The label of the sample. If "Include group name in label?" is selected, then the name of the thread group is added as a prefix. This allows identical labels from different thread groups to be collated separately if required.
- # Samples - The number of samples with the same label
- Average - The average time of a set of results
- Median - The median is the time in the middle of a set of results. 50% of the samples took no more than this time; the remainder took at least as long.
- 90% Line - 90% of the samples took no more than this time. The remaining samples at least as long as this. (90 th percentile )
- Min - The shortest time for the samples with the same label
- Max - The longest time for the samples with the same label
- Error % - Percent of requests with errors
- Throughput - the Throughput is measured in requests per second/minute/hour. The time unit is chosen so that the displayed rate is at least 1.0. When the throughput is saved to a CSV file, it is expressed in requests/second, i.e. 30.0 requests/minute is saved as 0.5.
- Kb/sec - The throughput measured in Kilobytes per second
Times are in milliseconds.
Control Panel
The figure below shows an example of selecting the "Include group name" checkbox.
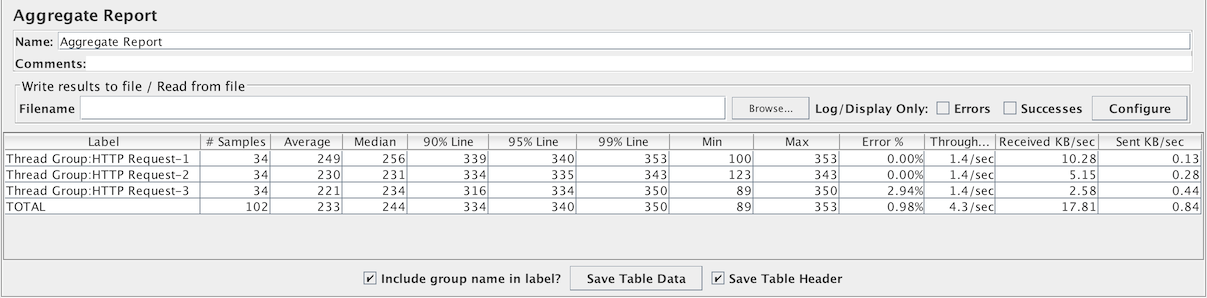
Sample "Include group name" display
18.3.14 Mailer Visualizer
The mailer visualizer can be set up to send email if a test run receives too many failed responses from the server.
Control Panel
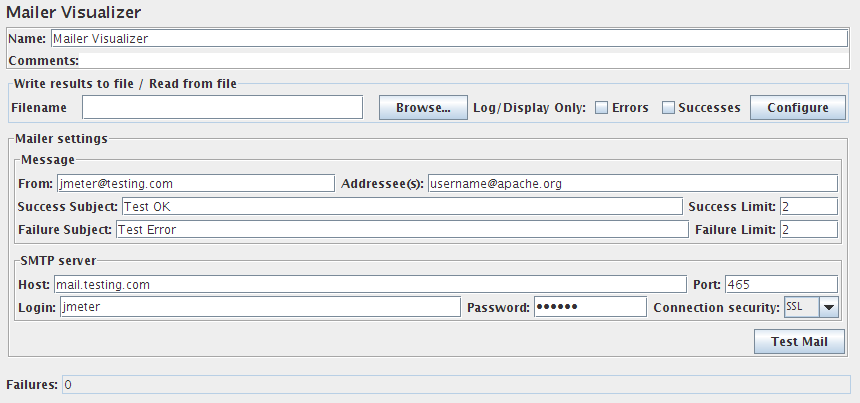
Parameters
- jmeter之监听器
- jmeter之监听器
- jmeter之监听器
- jmeter 监听器
- jmeter 监听器
- JMeter-监听器
- Jmeter之五:监听器(一)
- Jmeter之五:监听器(二)
- JMeter学习-019-JMeter 监听器之【聚合报告】界面字段解析及计算方法概要说明
- Jmeter监听器图形结果插件
- jmeter结果分析(监听器):
- 如何为Apache JMeter开发插件(五)——监听器之Report (报告)
- 如何为Apache JMeter开发插件(六)——监听器之Vizualizer(监视器)
- JMETER中监听器无结果解决办法
- 第十四讲、jmeter中的监听器以及测试结果分析
- JMeter安装插件,添加jp@gc-perfMon Metrice Collector监听器
- servlet之监听器
- jsp之监听器
- Algorithms—54.Spiral Matrix
- CentOS 6.5 服务端配置vnc-server windows客户端远程桌面访问CentOS 6.5
- GRE写作必备句型
- Java MessageFormat.format的用法
- 二叉搜索树与双向链表
- jmeter之监听器
- 手动脱NsPacK壳实战
- 2012年5月SAT香港真题解析
- 用WaitForSingleObject()函数实现简单的多线程互斥访问
- Git命令及使用
- Flume分布式日志收集收集系统
- javascript正整数,输入验证,字节长度计算
- 解决root用户无法登录mysql
- SCCM 2012安装教程(Part1)