JBoss调优(一)JVM调优
来源:互联网 发布:北斗星通是大数据吗 编辑:程序博客网 时间:2024/06/16 05:43
原文:
http://www.mastertheboss.com/jboss-server/jboss-performance/jboss-as-7-performance-tuning?showall=
Tuning JBoss application server
Although many architects and software engineer agree that about 70-80% of the application performance depends on how the application itself is coded—a poorly configured server environment can affect your user experience significantly, and eventually, on your application value.
The amount of configuration elements, which can influence your server performance are quite a lot; however, some of them deserve a special attention:
• JVM tuning
• Application server resource pooling
• Logging
• Caching data
Let's see each element in detail
JVM tuning
The JBoss AS 7 runs within a Java Virtual Machine (JVM), hence it's natural that the AS can give a better performance with proper configuration of the JVM parameters.
JVM tuning has evolved over the years and actually changed with each version of Java. Since the release 5.0 of the J2SE, the JVM is able to provide some default configuration ("Ergonomics") which is consistent with your environment. However, the smarter choice provided by Ergonomics is not always the optimal and without an explicit user setting, the performance can fall below your expectations.
Basically, the JVM tuning process can be divided into the following steps:
• Choose a correct JVM heap size. This can be divided into setting an appropriate initial heap size (-Xms) and a maximum heap size (-Xmx).
• Choose a correct Garbage collector algorithm.
Let's see both elements more in details.
Choosing the correct JVM heap size
Java objects are created in Heap; each heap is divided into three parts or generations for sake of garbage collection in Java. These are called asYoung generation, Tenured or Old generation, andPermanent area of heap.
New Generation is further divided into three parts known as Eden space, Survivor 1, and Survivor 2 space. When an object is first created in heap, it gets created in new generation inside Eden space, and after a subsequent minor Garbage collection if the object survives, it gets moved to survivor 1, and then to Survivor 2 before the major garbage collection moved that object to Old or Tenured generation.
Permanent generation of Heap or Perm Area of Heap is somewhat special and it is used to store meta data related to the classes and methods in JVM; it also hosts String pool provided by JVM.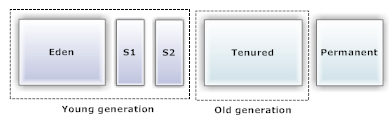
In order to tune the JVM, you should choose a correct ratio between young generation (where objects are initially placed after instantiation) and the tenured generation (where old living generations are moved).
For most applications, the correct ratio between the young generation and the tenured generation ranges between 1/3 and close to 1/2.
The appropriate max heap size can be determined by testing your application with a peak load for a consistent time. Once you have determined the peak of memory demanded by your application, you can allow an extra25-40% additional maximum heap size, depending on the nature of your application.
As far as it concerns, the initial heap size, a good rule of thumb is to set it to be the same as the maximum heap size. This increases predictability and avoids the need to allocate memory to expand the heap. This is particularly useful for production environment, while developers (who have limited resources) might choose a smaller initial heap size.
Keep this suggested configuration as a reference for smaller environments and also for larger ones:
java -Xmx1024m -Xms1024m -XX:MaxNewSize=448m -XX:NewSize=448m -XX:SurvivorRatio=6
java –Xmx2048m –Xms2048m -XX:MaxNewSize=896m -XX:NewSize=896m -XX:SurvivorRatio=6
Tuning the garbage collector
Garbage collection is a mechanism provided by Java Virtual Machine to reclaim heap space from objects, which are eligible for Garbage collection.
An object becomes eligible for Garbage collection or GC if it is not reachable from any live threads or any static references. In other words, you can say that an object becomes eligible for Garbage collection if all its references are null.
Choosing the correct Garbage collector algorithm is a key (but often overlooked) factor which plays an important role in reaching your service level requirements. There are several garbage collectors available as:
• Serial collector (-XX:+UseSerialGC): It performs garbage collector using a single thread which stops other JVM threads. This collector is fit for smaller applications; we don't advice using it for Enterprise applications.
• Parallel collector (-XX:+UseParallelGC): It performs minor collections in parallel and because J2SE 5.0 can also perform major collections in parallel (-XX:+UseParallelOldGC). This collector is fit for multiprocessor machines and applications requiring high throughput. It is also a suggested choice for applications which produces a fragmented Java heap, allocating large-size objects at different timelines.
• Concurrent collector (-XX:+UseConcMarkSweepGC): It performs most of its work concurrently using a single garbage collector thread that runs with the application threads simultaneously. It is fit for fast processor machines and applications with a strict service-level agreement. It can be the best choice, also for applications using a large set of long-lived objects live HttpSessions.
The new G1 collector
One of the major enhancements in Java 7 is the new G1 ("Garbage first") low-latency garbage collector planned to replace CMS in the Hotspot JVM. It is a server-style collector, targeted at multiprocessor machine with large amounts of memory.
The G1 collector is a departure from earlier collectors which had a physical separation between the young and old generations. With G1, even though it is generational, there is no physical separation between the two generations.This collector that divides the entire space into regions and allows a set of regions to be collected, rather than split the space into an arbitrary young and old generation.
The key features of the G1 collector are:
1. G1 uses parallelism which are mostly used in hardware today. The main advantage of G1 is designed in such a way to make use of all the available CPUs and utilize the processing power of all CPUs as well as increase the performance and speed up the garbage collection.
2. Next feature which plays a key role in increasing the garbage collection is treating the young objects(newly created) and the old objects (which lived for some time)differently. G1 mainly focuses on young objects as they can be reclaimable when traversing the old objects.
3. Heap compaction is done to eliminate fragmentation problems. In essence, because G1 compacts as it proceeds, it copies objects from one area of the heap to the other. Therefore, because of compaction, it will not encounter fragmentation issues that CMS might. There will always be areas of contiguous free space from which to allocate, allowing G1 to have consistent pauses over time.
Compared to CMS, the G1 collector is also much easier to use, because it has a lesser number of switches and hence tuning VM is simpler. G1 is already present in JDK 7 as of now and one can try it. To use G1, these two switches need to be passed:
-XX:+UnlockExperimentalVMOptions -XX:+UseG1GC
Using large memory pages
Another area of the JVM tuning which can yield substantial benefits to your application is the usage of large memory pages. Large memory pages is a feature of modern CPUs that allow memory-hungry applications to allocate memory in 2-4 MB chunks, instead of the standard 4KB. Beginning with Java SE 5.0, there is a cross-platform flag for requesting large memory pages:-XX:+UseLargePages (On by default for Solaris, Off by default for Windows and Linux).
The goal of large-page support is to optimize processorTranslation Lookaside Buffer (TLB). A Translation Lookaside Buffer is a page translation cache that holds the most-recently used virtual-to-physical address translation. TLB is a scarce system resource. A TLB miss can be costly as the processor must then read from the hierarchical page table, which may require multiple memory accesses. By using bigger page size, a single TLB entry can represent large memory ranges. There will be less pressure on TLB, and the memory-intensive applications may have better performance.
Large memory pages are available with the 64-bit JVM. (Red Hat Enterprise Linux does let you allocate large pages on the 32-bit OS, but you get an illegal argument when starting the JVM).
The Sun JVM, as well as OpenJDK, requires the following option, passed on the command line, to use large pages:-XX:+UseLargePages.
Application server resource pools
Application server pools are used because the very first release of any application server as means to set boundaries for the resources they contain.
Resource pooling offer several benefits, like:
• Improved performance: You can re-assign resource-intensive objects such as a database connection instead of creating and destroying them every time.
• Improved security: By granting a limited number of resources, you prevent plundering of server resources from applications which could eventually lead to an interruption of the AS services.
JBoss AS 7 uses several resource pools to manage different kind of services. The application server ships with a default configuration for all resource pools which could be just good for simple applications. If you are planning to write mission-critical applications, however, you need to find the appropriate number of resources to be assigned to your pools.
We will discuss in particular on the following pool of resources, which ultimately play an important role on performance tuning:
• The database connection pool
• The EJB pool used by Stateless EJBs and MDBs
• The Web server pool of threads
At the time of writing, the application server is not ready to produce performance metrics for all the subsystem which we have mentioned. Although, it would be preferable to monitor the application server pools through management interfaces, you can still have a look inside the application server pools using some other tools or with a minimal sample application. That's what we will do in the next sections. (We'll however update this article as soon as the performance tuning metrics are available so come back to visit us soon!)
- JBoss调优(一)JVM调优
- jvm调优(一)
- jvm调优(一) 概念
- JBoss调优(jboss-5.1.0.GA)
- java-jvm调优(一)
- Jboss文档(一)
- jboss(一)--安装
- JBoss调优
- Jboss调优
- Jboss调优
- Jboss调优
- Jboss调优
- JVM(4):JVM 调优
- JVM(6):JVM 调优
- JVM(7):JVM 调优
- JBoss技术支持文档(一)
- jboss配置入门(一)
- jboss性能优化(一)
- HDU 3046 Pleasant sheep and big big wolf(最小割)
- Hibernate ehcache配置二级缓存
- iOS int long NSInteger 入门与兼容问题讲解,让你秒懂
- 配置文件工具类
- UILable写出类似Cell的UITableViewCellStyleSubtitle状态下效果
- JBoss调优(一)JVM调优
- sizeof(void*)
- Ctemplate的简介
- 实训项目-银行储蓄系统
- C main的反汇编简单介绍
- Android Json解析之直接对象解析
- 如何解决 “fatal error C1083: ”无法打开包括文件
- Java通过SMS短信平台实现发短信功能
- LINUX select socket编程 TCP