web流程图JS插件:dagre-d3
来源:互联网 发布:ios最简单的链式编程 编辑:程序博客网 时间:2024/05/31 05:27
在Github上找到了一个开源项目:dagre-d3.
看名字就能猜到它是基于D3库的,D3是一个专门用于前端图形绘制的库,dagre-d3就是实现自动布局并且绘制流程图的这么一个东西:
Dagre is a JavaScript library that makes it easy to lay out directed graphs on the client-side. The dagre-d3 library acts a front-end to dagre, providing actual rendering using D3.
上一个简单的Demo:
// Create a new directed graphvar g = new dagreD3.Digraph(); // Add nodes to the graph. The first argument is the node id. The second is// metadata about the node. In this case we're going to add labels to each of// our nodes.g.addNode("kspacey", { label: "Kevin Spacey" });g.addNode("swilliams", { label: "Saul Williams" });g.addNode("bpitt", { label: "Brad Pitt" });g.addNode("hford", { label: "Harrison Ford" });g.addNode("lwilson", { label: "Luke Wilson" });g.addNode("kbacon", { label: "Kevin Bacon" }); // Add edges to the graph. The first argument is the edge id. Here we use null// to indicate that an arbitrary edge id can be assigned automatically. The// second argument is the source of the edge. The third argument is the target// of the edge. The last argument is the edge metadata.g.addEdge(null, "kspacey", "swilliams", { label: "K-PAX" });g.addEdge(null, "swilliams", "kbacon", { label: "These Vagabond Shoes" });g.addEdge(null, "bpitt", "kbacon", { label: "Sleepers" });g.addEdge(null, "hford", "lwilson", { label: "Anchorman 2" });g.addEdge(null, "lwilson", "kbacon", { label: "Telling Lies in America" });它渲染出来是这样的:
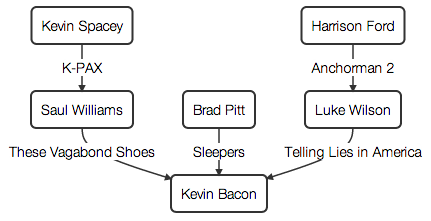
这样我们只要把数据处理成对应格式,就可以轻松的自动绘制会流程图.比较给力的是它对数据的支持良好,有多个格式可以选择,而且虽然接口不多,但是对于节点以及线条的操作都有,可以很轻松的改变节点以及线条的样式,这个大家可以看官方的demo.
另外如果要附加交互事件,可以通过jquery实现,也很容易,我使用bootstrap的tooltip很轻松的就加上去了.感觉还是个很给力的库,而且国内这方面资料感觉不多,分享给大家.
原文地址:通过数据自动生成流程图(前端方向)
0 0
- web流程图JS插件:dagre-d3
- jQuery+d3绘制流程图
- D3.js写的标签云插件
- SVG 绘制流程图相关Web插件
- D3 .JS
- d3 js
- d3.js
- d3.js
- D3.js
- d3.js
- d3.js
- 流程图插件
- web 流程图
- 【D3.js】D3.js入门感悟、学习指南
- mxGraph 1.9.2.0 发布 WEB流程图JS库
- D3.js常用方法
- d3.js读书笔记-1
- d3.js读书笔记-2
- SystemUI源码提取到eclipse中编译
- 12 个 CSS 高级技巧汇总
- PHP上传图片文件
- jQuery 的$.extend和$.fn.extend作用及区别
- HDU 1385 Minimum Transport Cost(最短路Floyd+标记路径)
- web流程图JS插件:dagre-d3
- python学习
- 产品之路:如何快速学习产品?
- iOS系统中各种设置项的URL链接 跳转到设置页面
- idea bearcat 文件模板
- java swing 窗口界面关闭事件响应
- SEO
- 项目需求将上传的文件统一FTP传送到一个服务器
- Vector & ArrayList ,ArrayList & LinkedList,Hashtable & HashMap