一个简单的性能计数器:CodeTimer
来源:互联网 发布:山东网络继续教育学院 编辑:程序博客网 时间:2024/05/23 13:02
转载自老赵的博客:http://blog.zhaojie.me
原文链接:http://blog.zhaojie.me/2009/03/codetimer.html
有数据,有真相,相信大家在平时的工作或学习过程中,都需要比较几种不同方法或实现之间的性能差距。在这些时候,往往就需要我们不断地创建Stopwatch,打开,关闭,然后打印时间。这种一遍又一遍的重复终有一天会让人忍无可忍,因此如果能有一个“标准”的性能计数器,那应该可以让生活轻松许多。这个性能计数器不用复杂,够用就好;也不需要考虑扩展性,要扩展时直接修改代码就够了;同样不需要考虑输出格式,直接打印在Console就行。
在上次的.NET技术大会中,Jeffrey Richter大叔在Keynote Session中进行了一个名为“The Performance of Everyday Things”的主题演讲,展示了各种常用编程元素之间的性能对比。在演示中他使用了一个名为CodeTimer的简单计数器,用于统计每种做法的性能。可惜翻遍了每个地方都没发现JR大叔在哪里公开了这个计数器的实现。算了,那么就凭着印象写一个出来吧,反正也不复杂。
总的来说,CodeTimer有两个公开方法,一个是Initialize,一个是Time:
public static class CodeTimer{ public static void Initialize() { Process.GetCurrentProcess().PriorityClass = ProcessPriorityClass.High; Thread.CurrentThread.Priority = ThreadPriority.Highest; Time("", 1, () => { }); } public static void Time(string name, int iteration, Action action) { ... }}CodeTimer.Initialize方法应该在测试开始前调用。首先它会把当前进程及当前线程的优先级设为最高,这样便可以相对减少操作系统在调度上造成的干扰。然后调用一次Time方法进行“预热”,让JIT将IL编译成本地代码,让Time方法尽快“进入状态”。Time方法则是真正用于性能计数的方法,实现如下:
public static void Time(string name, int iteration, Action action){ if (String.IsNullOrEmpty(name)) return; // 1. ConsoleColor currentForeColor = Console.ForegroundColor; Console.ForegroundColor = ConsoleColor.Yellow; Console.WriteLine(name); // 2. GC.Collect(GC.MaxGeneration, GCCollectionMode.Forced); int[] gcCounts = new int[GC.MaxGeneration + 1]; for (int i = 0; i <= GC.MaxGeneration; i++) { gcCounts[i] = GC.CollectionCount(i); } // 3. Stopwatch watch = new Stopwatch(); watch.Start(); ulong cycleCount = GetCycleCount(); for (int i = 0; i < iteration; i++) action(); ulong cpuCycles = GetCycleCount() - cycleCount; watch.Stop(); // 4. Console.ForegroundColor = currentForeColor; Console.WriteLine("\tTime Elapsed:\t" + watch.ElapsedMilliseconds.ToString("N0") + "ms"); Console.WriteLine("\tCPU Cycles:\t" + cpuCycles.ToString("N0")); // 5. for (int i = 0; i <= GC.MaxGeneration; i++) { int count = GC.CollectionCount(i) - gcCounts[i]; Console.WriteLine("\tGen " + i + ": \t\t" + count); } Console.WriteLine();}private static ulong GetCycleCount(){ ulong cycleCount = 0; QueryThreadCycleTime(GetCurrentThread(), ref cycleCount); return cycleCount;}[DllImport("kernel32.dll")][return: MarshalAs(UnmanagedType.Bool)]static extern bool QueryThreadCycleTime(IntPtr threadHandle, ref ulong cycleTime);[DllImport("kernel32.dll")]static extern IntPtr GetCurrentThread();Time方法接受三个参数,名称,循环次数以及需要执行的方法体。打印出花费时间,消耗的CPU时钟周期,以及各代垃圾收集的回收次数。具体实现分几个步骤,如下:
- 保留当前控制台前景色,并使用黄色输出名称参数。
- 强制GC进行收集,并记录目前各代已经收集的次数。
- 执行代码,记录下消耗的时间及CPU时钟周期1。
- 恢复控制台默认前景色,并打印出消耗时间及CPU时钟周期。
- 打印执行过程中各代垃圾收集回收次数。
与传统计数方法相比,这段代码还输出了更多信息:CPU时钟周期及各代垃圾收集回收次数。CPU时钟周期是性能计数中的辅助参考,说明CPU分配了多少时间片给这段方法来执行,它和消耗时间并没有必然联系。例如Thread.Sleep方法会让CPU暂时停止对当前线程的“供给”,这样虽然消耗了时间,但是节省了CPU时钟周期:
CodeTimer.Time("Thread Sleep", 1, () => { Thread.Sleep(3000); });CodeTimer.Time("Empty Method", 10000000, () => { });结果如下:

而垃圾收集次数的统计,即直观地反应了方法资源分配(消耗)的规模:
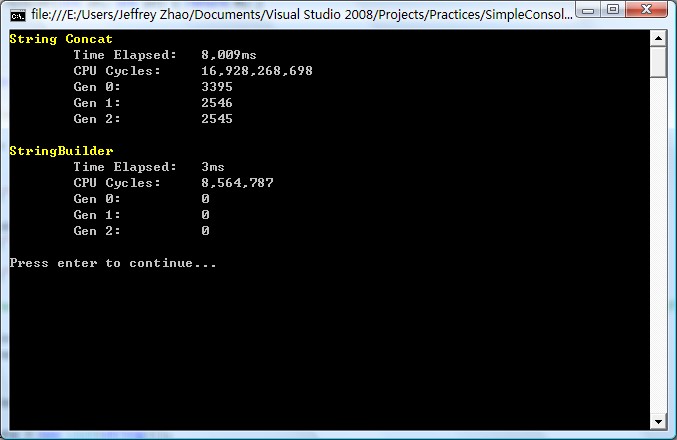
int iteration = 100 * 1000;string s = "";CodeTimer.Time("String Concat", iteration, () => { s += "a"; });StringBuilder sb = new StringBuilder();CodeTimer.Time("StringBuilder", iteration, () => { sb.Append("a"); });结果如下:
老赵最近在研究一个问题的几种不同做法在性能上的优劣,其中CodeTimer起到了很重要的作用——这边也先卖个关子,接下来老赵也将会写几篇文章来讲解这个问题。
注1:统计CPU时钟周期时使用P/Invoke访问QueryThreadCycleTime函数,这是Vista和Server 2008中新的函数。感谢装配脑袋在这里提供的帮助。
注2:对于.NET 2.0及Vista以下操作系统,请参考《对老赵写的简单性能计数器的修改》
- 一个简单的性能计数器:CodeTimer
- 一个简单的性能计数器:CodeTimer
- 一个简单的性能计数器:CodeTimer
- 老赵的性能计数器:CodeTimer
- 一个简单的性能计数器
- 一个简单的性能计数器
- 一个简单的计数器
- 一个简单的网页计数器
- 一个简单的图形计数器
- 一个简单计数器的源代码
- jsp 一个简单的计数器
- JSP简单练习-一个简单的计数器
- 一个高效的C++性能计数器模板
- 一个简单的PHP图形计数器
- 一个用php3编写的简单计数器
- 一个简单的时钟频率计数器
- 04、 struts1 总结 一个简单的计数器
- application实现一个简单的网页计数器
- Unity3D实现地图编辑器的插件
- Displaying Bitmaps Efficiently (一)-----Loading Large Bitmaps Efficiently
- 优化UITableViewCell高度计算
- Android View布局xml常用 属性详解
- Codevs 侦探推理
- 一个简单的性能计数器:CodeTimer
- 关于编程的一些小软件
- Vuforia 高通AR for Unity 自动聚焦
- codevs3969[Mz]平方和 矩阵快速幂以及斐波那契数列性质的应用
- Cocos Studio中声音组件(ComAudio)的获取与播放
- 网站用户登录系统设计——jsGen实现版
- 在AngularJS应用中实现认证授权
- OpenCV2:Mat属性type,depth,step
- Scanner用法详解