【网摘】Data Modeling 简介
来源:互联网 发布:怎么逃避淘宝清洗订单 编辑:程序博客网 时间:2024/06/08 18:54
随着数据库学科的发展,数据模型的概念也逐渐深入和完善。早期,一般把数据模型仅理解为数据结构。其后,在一些数据库系统中,则把数据模型归结为数据的逻辑结构、物理配置、存取路径和完整性约束条件等四个方面。现代数据模型的概念,则认为数据结构只是数据模型的组成成分之一。数据的物理配置和存取路径是关于数据存储的概念,不属于数据模型的内容。此外,数据模型不仅应该提供数据表示的手段,还应该提供数据操作的类型和方法,因为数据库不是静态的而是动态的。因此,数据模型还包括数据操作部分。
概念模型
逻辑模型
物理模型
重要模型编辑
网状模型用连接指令或指针来确定数据间的显式连接关系,是具有多对多类型的数据组织方式
关系模型以记录组或数据表的形式组织数据,以便于利用各种地理实体与属性之间的关系进行存储和变换,不分层也无指针,是建立空间数据和属性数据之间关系的一种非常有效的数据组织方法
原文:【网摘】Data Modeling 简介
Resource:
Data Modeling Resource Center: http://infogoal.com/dmc/dmcdmd.htm
Data Warehousing Tutorial: http://www.infogoal.com/datawarehousing/
What is Data Modeling?
Data modeling is the process of creating and extending data models which are visual representations of data and its organization. TheERD Diagram(Entity Relationship Diagram) is the most popular type of data model. Data models exist at multiple levels including:
- The Conceptual Data Model describes data from a high level. It defines the problem rather than the solution from
- the business point of view. It includes entities and their relationships. Typically the conceptual data model is
- developed first.
- The Logical Data Model describes a logical solution to a data project. It provides more details than the conceptual data model and is nearly ready for the creation of a database. These details includeattributes, the individual
- pieces of information that will be included. Typically the logical data model is developed second.
- The Physical Data Model describes the implementation of data in a physical database. It is the blueprint for the
- database. Typically the physical data model is developed third.
================================================================================
Data Modeling Basics
from http://www.infogoal.com/datawarehousing/data_modeling_basics.htm
Data models whether used for data warehousing or other purposes tend to be designed using commonly understood symbols and terminologies. This section will provide you with that grounding.
There are three levels of data modeling:
- Conceptual Data Model - a high level model that describes a problem.
- Logical Data Model - a detailed data model that describes a solution using business terms.
- Physical Data Model - a detailed data model that defines database objects. This model is needed to implement the models in a database and produce a working solution.
An entity is an object of interest to the enterprise. An entity can be a: person, organization, place, thing, activity, event, abstraction or idea.
Entities are represented as rectangles in the data model:
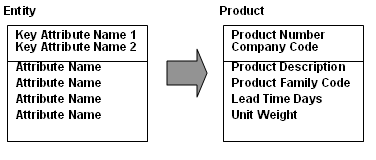
An attribute is a characteristic of an entity. It may contain data values, for example:
order number
account balance amount
marital status code
item description
skill level code
A relationship is an association between entities. Relationships are expressed as verbs or verb phrases. Data modeling focuses on binary relationships.for example:
customer places order
region contains district
employee has developed skill
sales representative is responsible for territory
===============================================================================
How to read a data model
from http://www.stevehoberman.com/readadatamodel.htm
Cardinality represents the symbols on both ends of a relationship that define the number of instances of each entity that can participate in the relationship. It is through cardinality that the data rules are captured and enforced. Without cardinality, the most we can say about a relationship is that two entities are connected in some way through a rule. For example,person andcompany have some kind of relationship, but we don’t know much more than this.
The domain of values to choose from to represent cardinality on a relationship is limited to three values:zero, one, or many.Many (some people read it asmore) means any number greater than one. We can’t specify an exact number (other than through documentation), as in “A car has four tires.” We can only say, “A car has many tires.”
Each side of a relationship can have a combination of zero, one, or many. Through the specification of one or many, the structural portion of the cardinality represents the quantity of each entity instance in the relationship. The RI portion of the cardinality focuses on ensuring valid values through the specification of zero or one.
Each of the cardinality symbols are illustrated through the following example ofproduct andorder line. A product is something that an organization sells in the hope of making a profit. An order line exists for each product on a particular order. For example, an order for five widgets and two doodads would mean two order lines in one order, with each order line tying back to a particular product. Formalizing the rules between product and order line, we have
Each product can appear on one or many order lines.
Each order line must contain one and only one product.
Fig. 5.1 captures these business rules.
Fig. 5.1 Product and order line, take 1

You need to know only three symbols to read any relationship. The small vertical line means “one.” The circle means “zero.” The triangle with a line through the middle means “many.” Some people call the “many” symbol acrow’s foot. The label (“Appear on”) on the line in this example helps in reading the relationship and understanding the rule that the relationship represents.
Every relationship has a parent and child. The parent entity appears on the “one” side of the relationship, and the child appears on the “many” side of the relationship. When you read a relationship, it is a good practice to start on the “one” side, because the entity there is typically the more independent of the two entities and sometimes provides a context for the child entity. Starting with the parent also adds consistency when interpreting the rules.
We use the word each in reading each relationship, starting with the parent side.
The relationship in fig. 5.1 is therefore read as follows:
Each product can appear on zero, one, or many order lines.
Each order line must belong to one and only one product.
This relationship most closely matches the original business rule that we talked about several paragraphs earlier. Let’s change the cardinality slightly between these two entities and read the resulting business rules.
Fig. 5.2 Product and order line, take 2

Fig. 5.2 is interpreted as follows:
Each product can appear on one or many order lines.
Each order line can belong to zero or one product.
Fig. 5.3 Product and order line, take 3

Fig. 5.3 is interpreted as follows:
Each product can appear on zero or one order line.
Each order line can belong to one and only one product.
Fig. 5.4 Product and order line, take 4

Fig. 5.4 is interpreted as follows:
Each product can appear on one or many order lines.
Each order line can belong to one or many products.
================================================================================
Data Modeling for Data Warehouse
from http://www.infogoal.com/datawarehousing/data_models_for_data_warehousing_and_business_intelligence.htm
A data model is a graphical view of data created for analysis and design purposes. Data modeling includes designing data warehouse databases in detail, it follows principles and patterns established inArchitecture for Data Warehousing and Business Intelligence.
If you need to understand this subject from the beginning check the article, Data Modeling Basics to learn key terms and concepts.
Data warehouse modeling includes:
- Top Down / Requirements Driven Approach
- Fact Tables and Dimension Tables
- Multidimensional Model/Star Schema
- Support Roll Up, Drill Down, and Pivot Analysis
- Time Phased / Temporal Data
- Operational Logical and Physical Data Models
- Normalization and Denormalization
- Model Granularity : Level of Detail
Areas that require specialized patterns are:
Data Mart / Frontroom - uses dimension modeling - the ROLAP star schema or the MOLAP cube
Data warehouse / Backroom - uses normalized ERD
- Staging / Landing Area - looks like source system
Data Modeling Tools
Data modeling involves visualizing data through use of graphical tools, so you will want to obtain a data modeling software package or use graphical capabilities in existing software. See the Data Management CenterData Modeling Directory for a list of data modeling tools and other resources.
We have used open source software to develop examples for this article so that readers will able to learn on their own without licensing fees. Data models have been developed using DBDesigner4 fromFabForce.Net. The target database is MySQL fromSun Software.
Data Modeling for Business Intelligence
It is best to organize data to best meet the needs of its users. Business intelligence commonly performs analytic operations on data such as:
- Query by multiple criteria
- "Slice and dice"
- Drill Down
- Roll Up
The "Dimensional Data Model" otherwise known as the "Star Schema" was developed by Ralph Kimball in the 1980s to support these business needs. This approach has stood the test of time and is the recommended way to organize data for business query and analysis.
The two major table types of the Star Schema are the Fact and the Dimension. The Fact contains quantitative measurements while the Dimension contains classification information. Each Fact is surrounded by the Dimensions that provide context to it, given the appearance of a star.
![]()
The Order Fact with dimensions is a classic example. In this case the Order Fact measurers order quantity and currency amount. Dimensions of Calendar Date, Product, Customer, Geo Location and Sales Organization put the Order Fact into context.
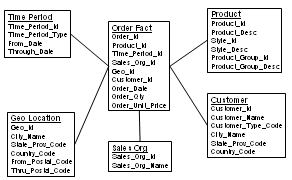
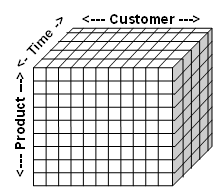
This star schema supports looking orders like a cube, enabling slicing and dicing by customer, time and product.
Surrogate Keys Improve Data Mart Efficiency and Performance
Surrogate keys, typical stored as integers, improve efficiency and increase performance. Joins between facts and dimensions are faster with integers. Indexes on integers are compact and provide rapid access.
Facts - the Data Mart Measuring Stick
Facts contain quantitative measurements. They focus on the answering the questions: how much and how many.
The grain is a determinant of the level of detail of the data mart fact. A fact can be fine grained and represent a single event or transaction or it can be course grained and aggregate measurements over a period of time.
Dimensions Put Data Mart Facts in Context
Dimensions enable business intelligence users to analyze data using simple queries. They focus on questions of: who, when, where and what. Typical dimensions include:
- Time period / calendar
- Product
- Customer
- Household
- Market Segment
- Geographic Area
The primary key of a dimension should a surrogate key and is typically an integer. This primary key is then related to facts to put the facts into context. Much of the data in a dimension is descriptive and stored character format. It often contains both code and expanded values such as territory_code and territory_name to simplify and speed up query.
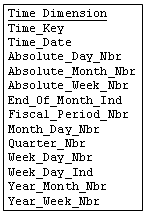
Time Dimensions are an important part of almost every dimensional model. We recommend that you establish Time Dimension tables rather hard coded date logic.
Use the finest grain - probably daily and account for days, weeks, quarters, seasons, holidays, etc.
Avoid Data Mart Snowflakes
Dimensions are directly related to facts to enable simple and rapid query. The snowflake is an extension to a dimension intended to reduce storage and duplication. It has the undesirable side effect of complicating and slowing queries.
Bridge Tables Implement Data Mart Hierarchies
The bridge table supports a many to many relationship between facts and dimensions. For example, a bridge table could show the percentage commission split between multiple sales reps (dimension) and a sale (fact).
Data Modeling Slowly Changing Dimensions
At times, dimension data must change and that must be handled in the data mart. Ralph Kimball has identified the followingslowly changing dimension (SCD) types that are widely recognized in data mart design:
(1) SCD Type 1 ---- Data is overwritten and prior data is not retained.
(2) SCD Type 2 ---- A new row with the changed data.
(3) SCD Type 3 ---- Update attributes with in the dimension row. For example, we could maintain both current customer status code and prior customer status code.
=================================================================================
- 【网摘】Data Modeling 简介
- 创建Entity Data Modeling
- data mining statistical modeling
- Data modeling essentials
- Qlikview Data Modeling---Concatenation
- Data Modeling In Redis
- Entity-Relational Data Modeling
- Data Modeling Essentials, Third Edition
- Data Modeling in Riak(转)
- Beginning Relational Data Modeling, Second Edition
- Basic Rules of Cassandra Data Modeling
- Data Modeling模型(建立ER模型)
- Data Modeling模型(导入ER模型)
- Database Modeling for Industrial Data Management: Emerging Technologies and Applications
- Spatial Data on the Web: Modeling and Management
- Data Modeling Fundamentals: A Practical Guide for IT Professionals
- Apache Cassandra Learning Step by Step (4): Data Modeling
- Qlikview Data Modeling---创建一个Key/Link Table
- LeetCode(111) Minimum Depth of Binary Tree
- 为什么jQuery不能监听body的滚动事件呢?
- 浮点数的分数表达
- 欢迎使用CSDN-markdown编辑器
- Leetcode231 Power of Two
- 【网摘】Data Modeling 简介
- Java ShutdownHook 钩子的应用场景友好地清理现场
- 动态调入xib视图
- 【机器学习】非平衡数据集的机器学习常用处理方法
- 【Python】三种遍历文件目录的方法
- Android 自定义属性,系统控件扩展
- windows下使用GUI 把本地代码提交到git远程仓库
- 从源码角度深入理解Handler
- c++数据结构——模板类重写栈