Xcode OpenGL ES Tools Overview
来源:互联网 发布:做微信视频的软件 编辑:程序博客网 时间:2024/05/16 15:03
Xcode tools for debugging, analyzing, and tuning OpenGL ES applications are useful during all stages of development. The FPS Debug Gauge and GPU report summarize your app’s GPU performance every time you run it from Xcode, so you can quickly spot performance issues while designing and building your renderer. Once you’ve found a trouble spot, capture a frame and use Xcode’s OpenGL ES Frame Debugger interface to pinpoint rendering problems and solve performance issues.
Effectively using the Xcode OpenGL ES features requires some familiarity with Xcode’s debugging interface. For background information, read Xcode Overview.
Using the FPS Debug Gauge and GPU Report
The FPS debug gauge and accompanying GPU report, shown in Figure B-1, provide a high-level summary of your app’s OpenGL ES performance while it runs. By monitoring these displays when developing your app, you can discover performance issues as they arise and consider where to focus your tuning efforts.
Figure B-1 FPS Debug Gauge and GPU Report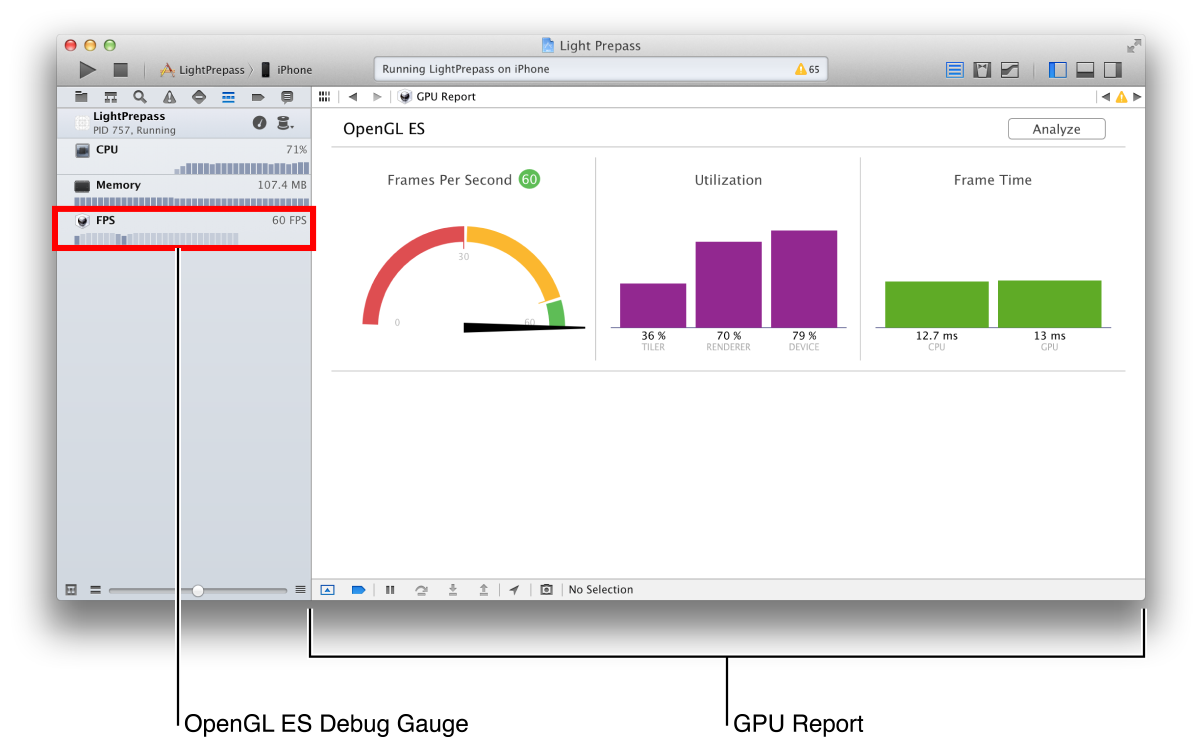
Note: Some features of the FPS gauge and GPU report rely on a display link timer. If you do not use the CADisplayLink or GLKViewController classes to animate your OpenGL ES displays, the gauge and report cannot show performance relative to a target frame rate or provide accurate CPU frame time information.
The debug gauge and report contain the following displays:
FPS Gauge. Shows the current animation rate of your app, in frames per second (FPS), and a recent history of FPS readings. Click this gauge to display the GPU report in Xcode’s primary editor.
Frames Per Second. Shows the current frame rate, relative to the target frame rate set by your app (often 30 or 60 FPS). A blue arc indicates the recent range of FPS readings.
Utilization. Shows three bars, breaking down your app’s use of the different processing resources on the GPU and indicating the possible locations of performance bottlenecks in your use of graphics hardware.
The Tiler bar measures use of the GPU’s geometry processing resources. High tiler utilization can indicate performance bottlenecks in the vertex and primitive processing stages of the OpenGL ES pipeline, such as using inefficient vertex shader code or drawing an excessive number of vertices or primitives each frame.
The Renderer bar measures use of the GPU’s pixel processing resources. High renderer utilization can indicate performance bottlenecks in the fragment and pixel processing stages of the OpenGL ES pipeline, such as using inefficient fragment shader code or processing additional fragments each frame for color blending.
The Device bar shows overall GPU usage, incorporating both tiler and renderer usage.
Frame Time. Shows the time spent processing each frame on both the CPU and GPU. This graph can indicate whether your app makes effective use of CPU/GPU parallelism.
If your app spends more time in CPU processing, you may be able to improve performance by moving work to the GPU. For example, if each frame requires many similar
glDrawArraysorglDrawElementscalls, you can use hardware instancing to reduce CPU overhead. (For details, see Use Instanced Drawing to Minimize Draw Calls.)If your app spends more time in GPU processing, you may be able to improve performance by moving work to the CPU. For example, if a shader performs the same calculation with the same result for every vertex or fragment during a particular draw call, you can perform that computation once on the CPU and pass its result to the shader in a uniform variable. (See Use Uniforms or Constants Instead of Computing Values in a Shader.)
Program Performance. Only appears after you capture a frame (see Capturing and Analyzing an OpenGL ES Frame below), showing the time spent in each shader program while rendering the captured frame, both in milliseconds and as a percentage of the total frame rendering time. Expanding the listing for a program shows the draw calls made using that program and the rendering time contribution from each. Select a program in the list to view its shader source code in the assistant editor, or click the arrow icon next to a draw call to select that call in the frame navigator (see Navigator Area below).
Note: The Program Performance view only appears when debugging on devices that support OpenGL ES 3.0 (regardless of whether your app uses an OpenGL ES 3.0 or 2.0 context).
When tuning your app, you can use this graph to find opportunities for optimization. For example, if one program takes 50% of the frame rendering time, you gain more performance by optimizing it than by improving the speed of a program that accounts for only 10% of frame time. Though this view organizes frame time by shader program, remember that improving your shader algorithms isn’t the only way to optimize your app’s performance—for example, you can also reduce the number of draw calls that use a costly shader program, or reduce the number of fragments processed by a slow fragment shader.
Problems & Solutions. Only appears after Xcode analyzes a frame capture (see Capturing and Analyzing an OpenGL ES Frame), this area lists possible issues found during analysis and recommendations for improving performance.
When you make changes to a GLSL shader program in a captured frame (see Editing Shader Programs below), the Frame Time and Program Performance graphs expand to show both the baseline rendering time of the frame as originally captured and the current rendering time using your edited shaders.
Capturing and Analyzing an OpenGL ES Frame
For a detailed look at your app’s OpenGL ES usage, capture the sequence of OpenGL ES commands used to render a single frame of animation. Xcode offers several ways to begin a frame capture:
Manual capture. While running your app in Xcode, click the camera icon in the debug bar (shown in Figure B-2) or choose Capture OpenGL ES Frame from the Debug menu.
Figure B-2 Debug Bar with Capture OpenGL ES Frame button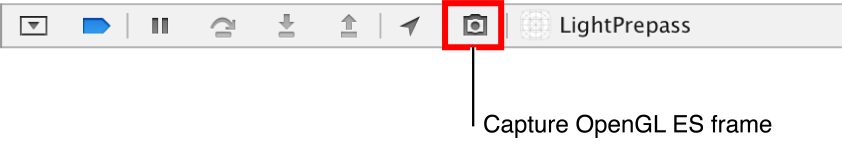
Note: The Capture OpenGL ES Frame button automatically appears only if your project links against the OpenGL ES or Sprite Kit framework. You can choose whether it appears for other projects by editing the active scheme. (SeeAbout the Scheme Editing Dialog.)
Breakpoint action. Choose Capture OpenGL ES Frame as an action for any breakpoint. When the debugger reaches a breakpoint with this action, Xcode automatically captures a frame. (See Setting Breakpoint Actions and Options.) If you use this action with an OpenGL ES Error breakpoint while developing your app (see Adding an OpenGL ES Error Breakpoint), you can use the OpenGL ES Frame Debugger to investigate the causes of OpenGL ES errors whenever they occur.
OpenGL ES event marker. Programmatically trigger a frame capture by inserting an event marker in the OpenGL ES command stream. The following command inserts such a marker:
glInsertEventMarkerEXT(0, "com.apple.GPUTools.event.debug-frame")
When the OpenGL ES client reaches this marker, it finishes rendering the frame, then Xcode automatically captures the entire sequence of commands used to render that frame.
After Xcode has captured the frame, it shows the OpenGL ES Frame Debugger interface. Use this interface to inspect the sequence of OpenGL ES commands that render the frame and examine OpenGL ES resources, as discussed in Touring the OpenGL ES Frame Debugger.
In addition, Xcode can perform an automated analysis of your app’s OpenGL ES usage to determine which parts of your renderer and shader architecture can benefit most from performance optimizations. To use this option, click the Analyze button at the top of the GPU report (shown at the top right in Figure B-1).
When you click the Analyze button, Xcode captures a frame (if one hasn’t been captured already), then runs your rendering code through a series of experiments using the attached iOS device. For example, to see if your rendering speed is limited by texture sizes, Xcode runs the captured sequence of OpenGL ES commands both with the texture data your app submitted to the GPU and with a size-reduced texture set. After Xcode finishes its analysis, the Problems & Solutions area of the GPU report lists any issues it found and suggestions for possible performance improvements.
Touring the OpenGL ES Frame Debugger
After Xcode captures a frame, it automatically reconfigures its interface for OpenGL ES debugging. The OpenGL ES Frame Debugger interface modifies several areas of the Xcode workspace window to provide information about the OpenGL ES rendering process, as shown in Figure B-3 and Figure B-4 and summarized below. (The frame debugger does not use the inspector or library panes, so you may wish to hide Xcode’s utility area during OpenGL ES debugging.)
Figure B-3 Frame debugger examining draw calls and resources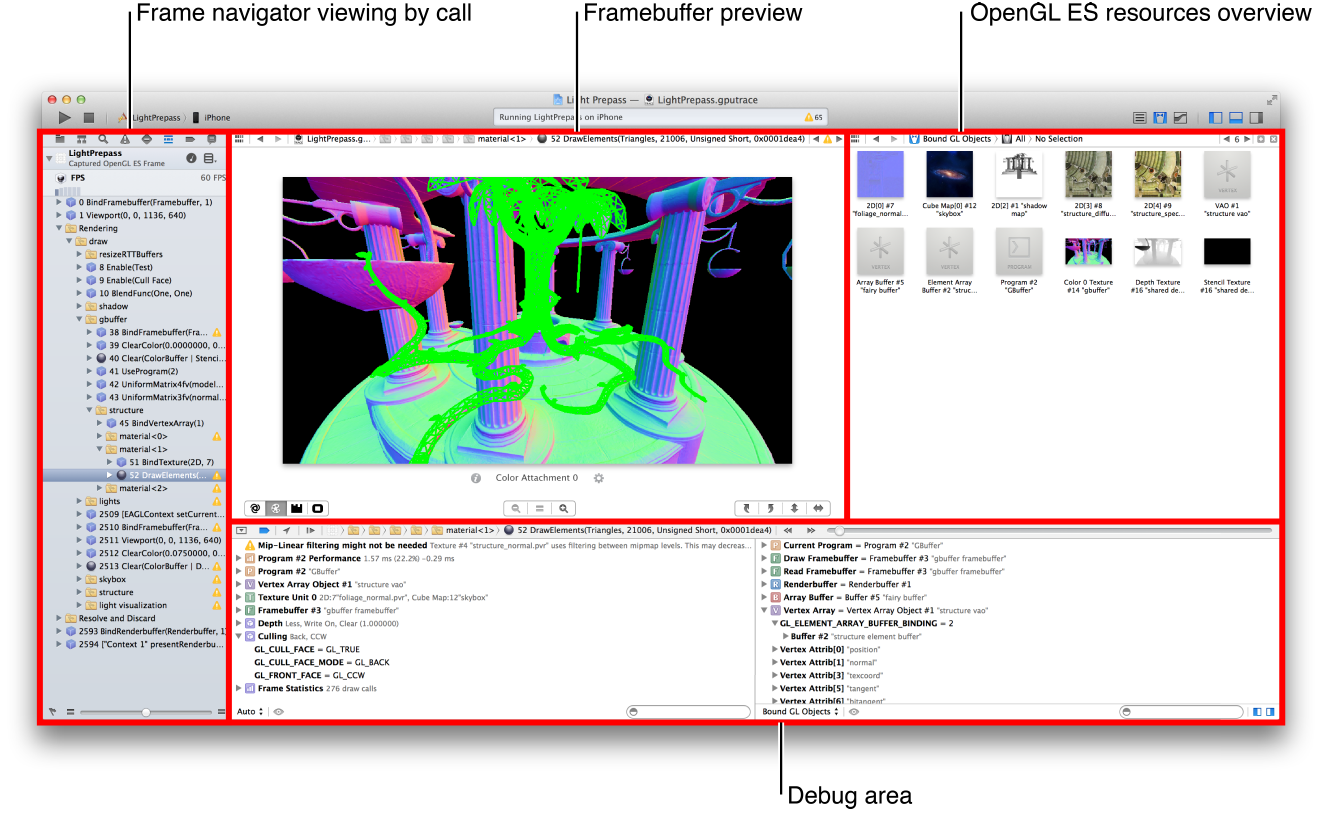 Figure B-4 Frame debugger examining shader program performance and analysis results
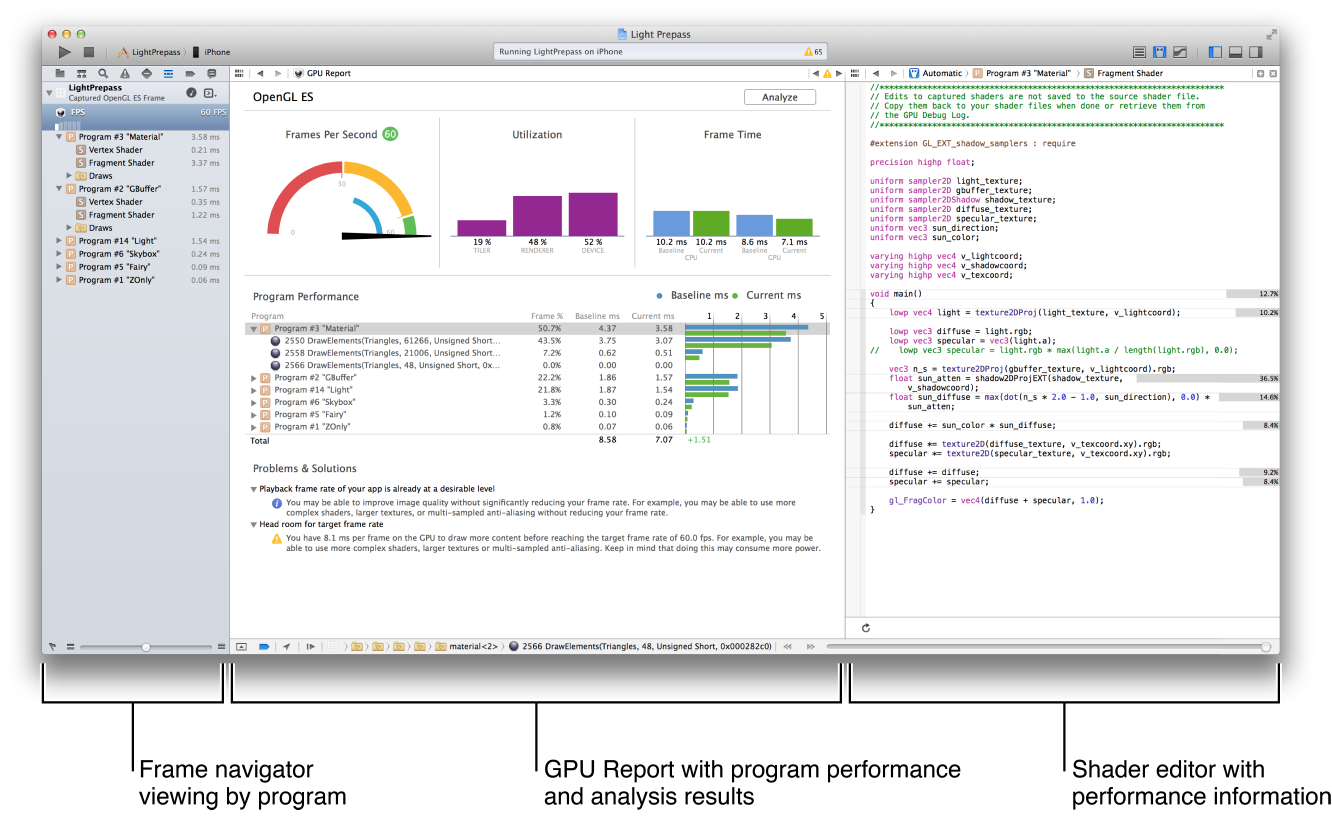
Navigator Area
In the OpenGL ES frame debugger interface, the debug navigator is replaced by the OpenGL ES frame navigator. This navigator shows the OpenGL ES commands that render the captured frame, organized sequentially or according to their associated shader program. Use the Frame View Options popup menu at the top of the frame navigator to switch between view styles.
Figure B-5 View Frame By popup menu in navigator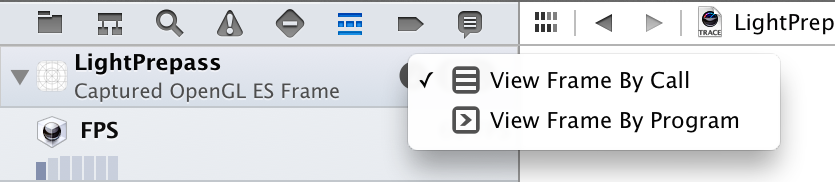
View Frame By Call
View the captured frame by call when you want to study OpenGL ES commands in sequence to pinpoint errors, diagnose rendering problems, or identify common performance issues. In this mode, the frame navigator lists commands in the order your app called them. Error or warning icons appear next to commands that result in OpenGL ES errors or that may indicate performance issues.
You can add structure to this list by using the glPushGroupMarkerEXT and glPopGroupMarkerEXT functions to annotate groups of OpenGL ES commands—these groups appear as folders you can expand or collapse to show more or less detail. (For details, see Annotate Your OpenGL ES Code for Informative Debugging and Profiling.) You can also expand an OpenGL ES command to show a stack trace indicating where in your application code the command was issued.
Use the context menu to choose whether to abbreviate command names and which commands, groups, and warnings to show. Use the flag icon at the bottom of the navigator to switch between showing all OpenGL ES commands and showing only those which draw into the framebuffer.
Clicking an OpenGL ES command in the list navigates to that point in the OpenGL ES command sequence, affecting the contents of other areas of the frame debugger interface, as discussed below, and showing the effects of the OpenGL ES calls up to that point on the attached device’s display.
View Frame By Program
View the captured frame by program when you want to analyze the GPU time spent on each shader program and draw command.
Expand the listing for a program to see the time contribution from each shader in the program and each draw call. Expand the listing for a draw call to show a stack trace indicating where in your application code that command was issued.
Use the context menu to refine the display—you can choose whether programs are sorted by their time contributions and whether timing information is displayed as a percentage of the total rendering time.
Clicking a program or shader shows the corresponding GLSL source code in the primary editor. Clicking an OpenGL ES command navigates to that point in the frame capture sequence.
Note: The View Frame By Program option is only available when debugging on devices that support OpenGL ES 3.0 (regardless of whether your app uses an OpenGL ES 3.0 or 2.0 context). On other devices, the Frame View Options popup menu is disabled.
Editor Area
When working with a frame capture, you use the primary editor to preview the framebuffer being rendered to, and the assistant editor to examine OpenGL ES resources and edit GLSL shader programs. By default, the assistant editor shows a graphical overview of all resources currently owned by the OpenGL ES context, as shown in Figure B-3. Use the assistant editor’s jump bar to show only those resources bound for use as of the call selected in the frame navigator, or to select an individual resource for further inspection. You can also double-click a resource in the overview to inspect it. When you select a resource, the assistant editor changes to a format suited for tasks appropriate to that resource’s type.
Previewing Framebuffer Contents
The primary editor shows the contents of the framebuffer as rendered by the draw call currently selected in the frame navigator. (If the selected OpenGL ES command in the frame navigator is not a drawing command—for example, a command that sets state such as glUseProgram—the framebuffer reflects the rendering done by the most recent draw call prior to the selection.) You can also navigate the sequence of OpenGL ES commands using the jump bar at the top of the primary editor.
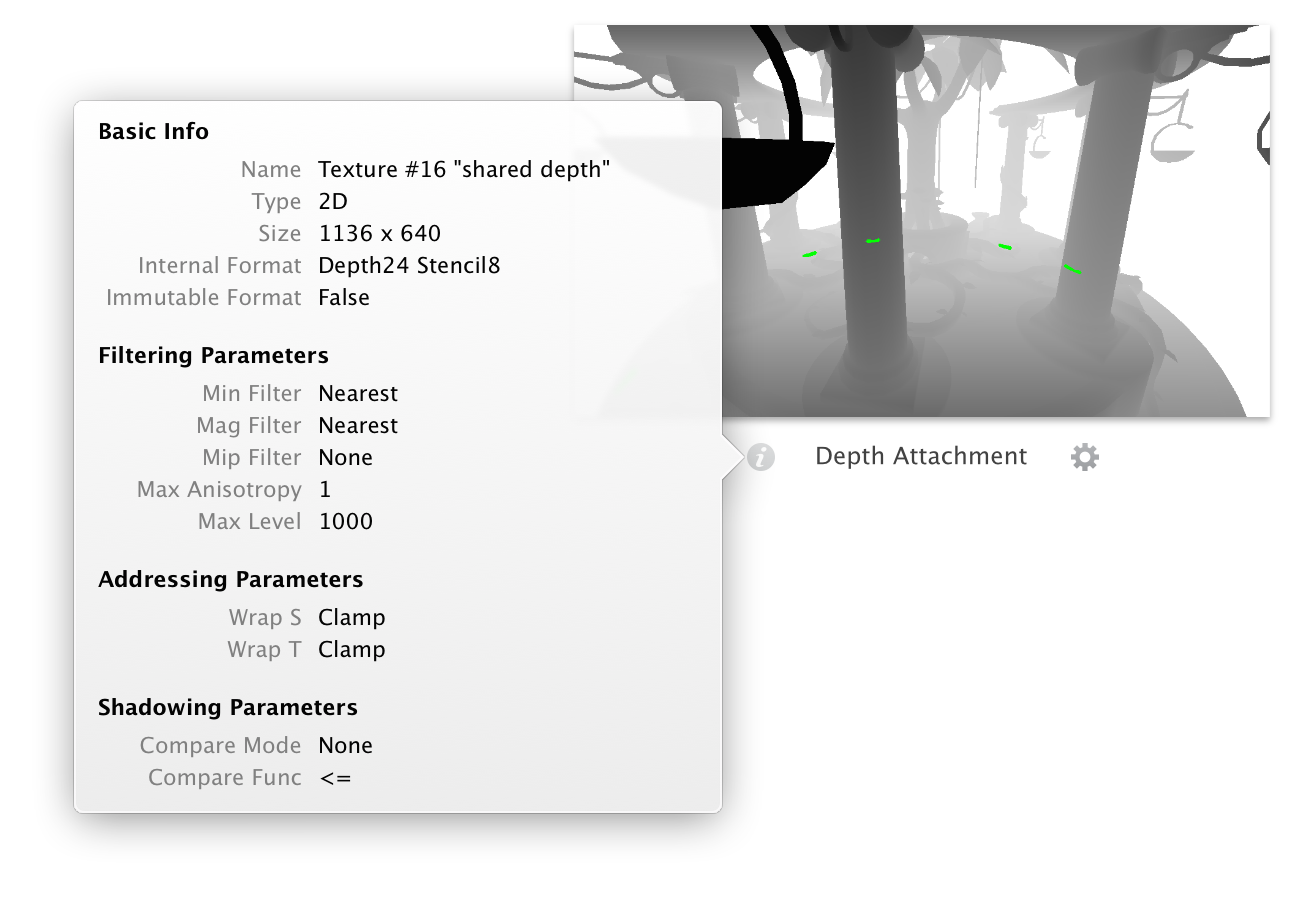
The editor shows a preview for each framebuffer attachment currently bound for drawing. For example, most approaches to 3D rendering use a framebuffer with attachments for both color and depth, as illustrated in . Use the controls in the lower left of the editor to choose which framebuffer attachments are currently shown. Clicking the info button, left of each framebuffer attachment’s name, shows a popover detailing the attachment’s properties, as shown in Figure B-6. Click the settings button, right of the framebuffer attachment’s name, to show a popover with controls that adjust the preview image. For example, you can use these controls to make a certain range of Z values in a depth buffer more visible in its grayscale preview, as shown in Figure B-7.
Figure B-7 Framebuffer settings popover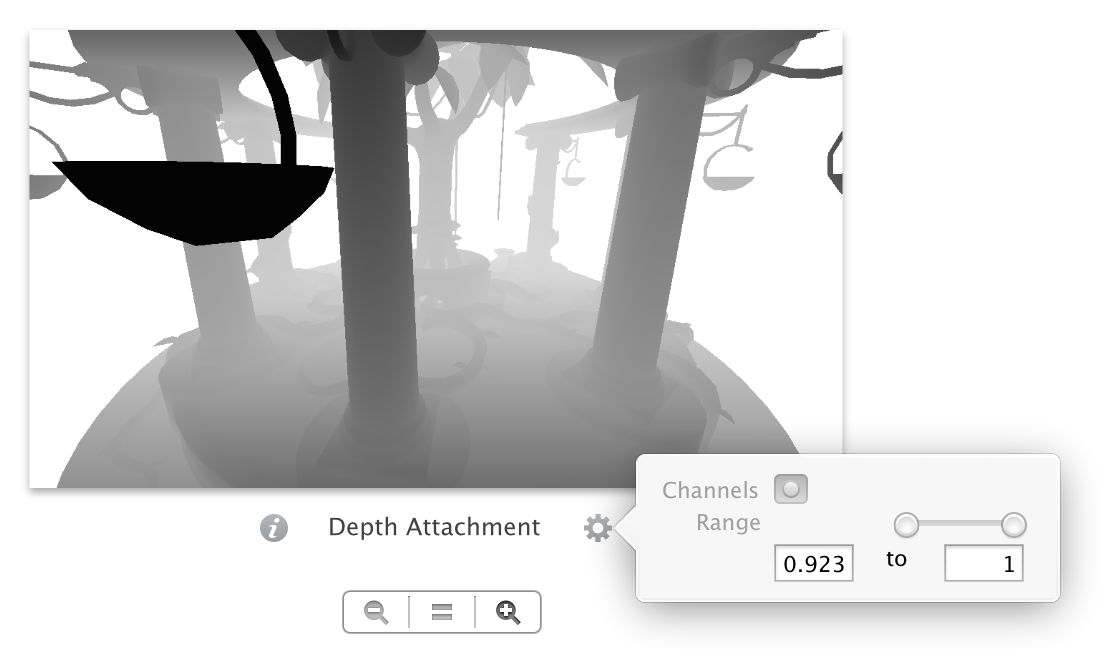
Each framebuffer attachment preview also shows a green wireframe highlighting the effect of the current draw call (as illustrated in Figure B-3). Use the context menu in a preview image to choose whether the highlight appears in the preview or on the display of the attached device.
Editing Shader Programs
When you select a shader program in the assistant editor’s jump bar or resource overview, the assistant editor shows the GLSL source code for that program’s fragment shader (as shown in Figure B-8). When you select a program in the frame navigator (seeView Frame By Program), the primary editor shows the program’s fragment shader and the assistant editor shows its vertex shader. In any editor showing a fragment shader, you can use the jump bar to switch to its counterpart vertex shader, and vice versa.
Figure B-8 GLSL shader source editor with update button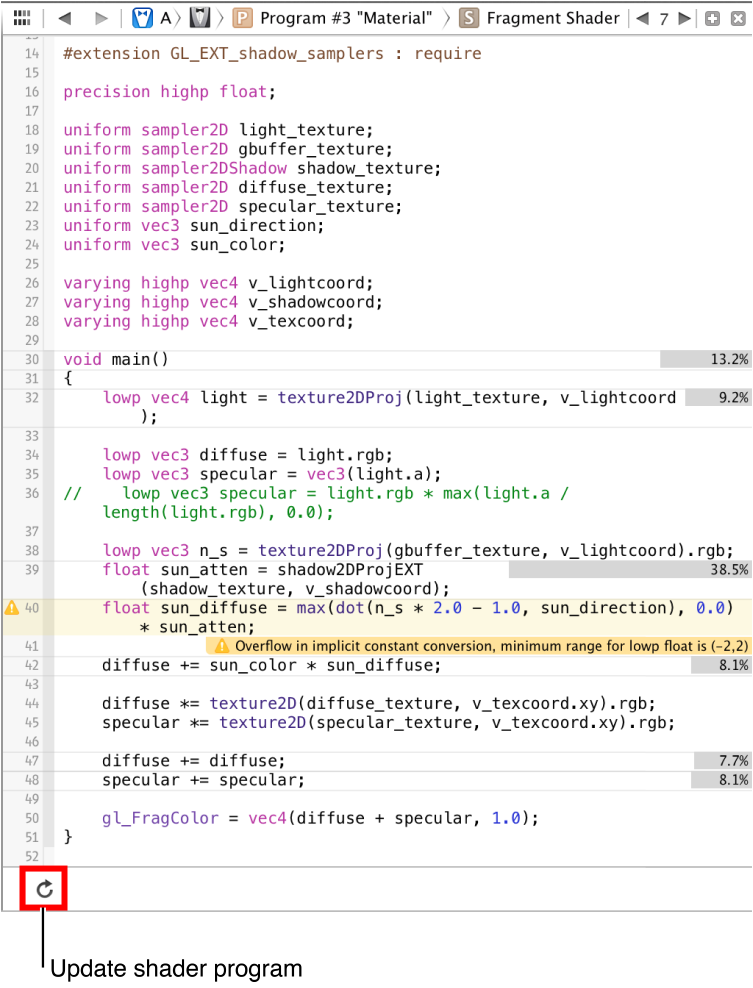
Each line of the shader source code is highlighted in the right margin with a bar representing its relative contribution to rendering time. Use these to focus your shader optimization efforts—if a few lines account for a greater share of rendering time, look into faster alternatives for those lines. (For shader performance tips, see Best Practices for Shaders.)
You can make changes to the shader source code in the editor. Then, click the Update button below the editor (shown in Figure B-8) to recompile the shader program and see its effects on the captured frame. If compiling the shader results in error or warning messages from the GLSL compiler, Xcode annotates the shader source code for each issue. The recompiled shader program remains in use on the device, so you can resume running your app. Click the Continue button in the debug bar to see your shader changes in action.
Inspecting Vertex Data
When you inspect an array buffer, the assistant editor shows the contents of the buffer (see Figure B-9). Because a buffer in OpenGL ES memory has no defined format, you use the pop-up menus at the bottom of the editor to choose how its contents appear (for example, as 32-bit integers or floating-point values, or as twice as many 16-bit integers or half-float values), and how many columns Xcode uses to display the data.
Figure B-9 Assistant editor previewing array buffer contents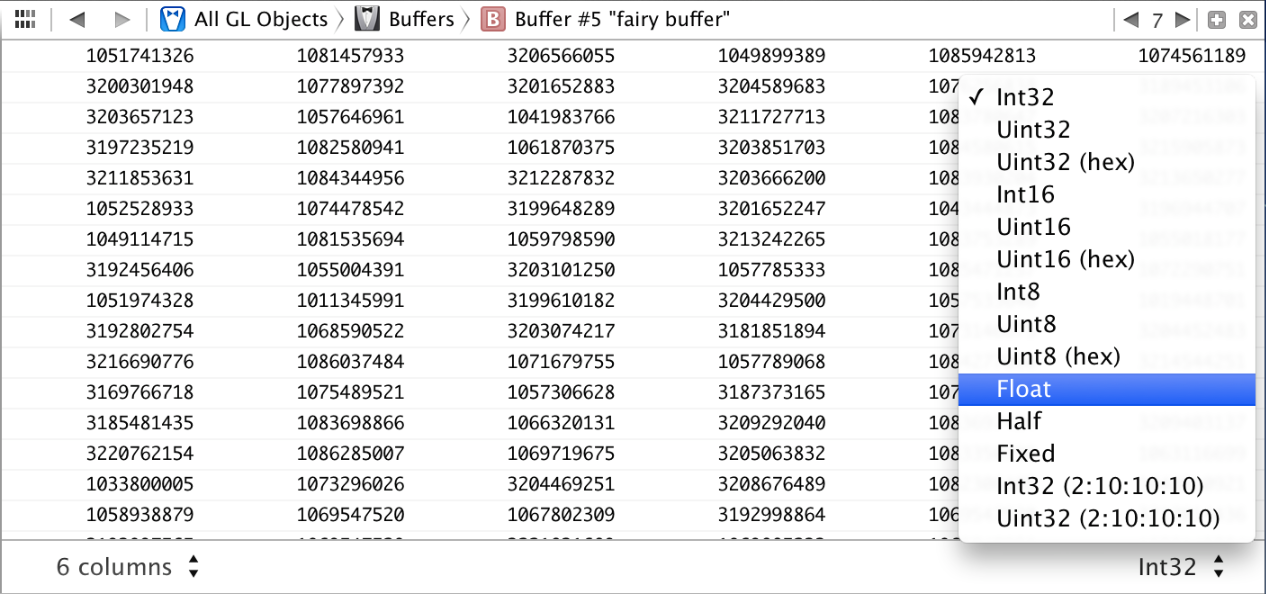
A vertex array object (VAO) encapsulates one or more data buffers in OpenGL ES memory and the attribute bindings used for supplying vertex data from the buffers to a shader program. (For details on using VAOs, see Consolidate Vertex Array State Changes Using Vertex Array Objects.) Because the VAO bindings include information about the format of the buffers’ contents, inspecting a VAO shows its contents as interpreted by OpenGL ES (see Figure B-10).
Figure B-10 Assistant editor previewing vertex array object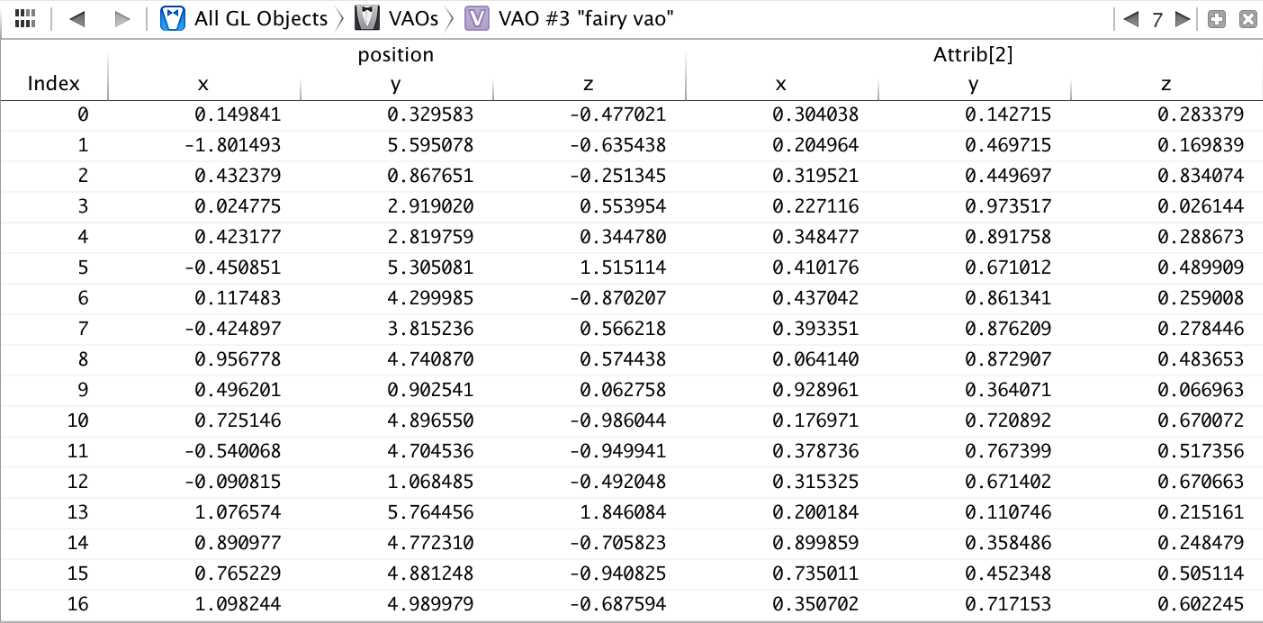
Viewing Textures or Renderbuffers
When you inspect a texture or renderbuffer, the assistant editor shows an image preview of its contents. You can use the same controls found in the primary editor to get more information about the texture object or renderbuffer and to adjust the image preview. For textures, you can use an additional control in the lower left corner of the assistant editor to preview each mipmap level of the texture and (if applicable) each face of a cube map texture (as shown in Figure B-11).
Figure B-11 Assistant editor previewing cube map texture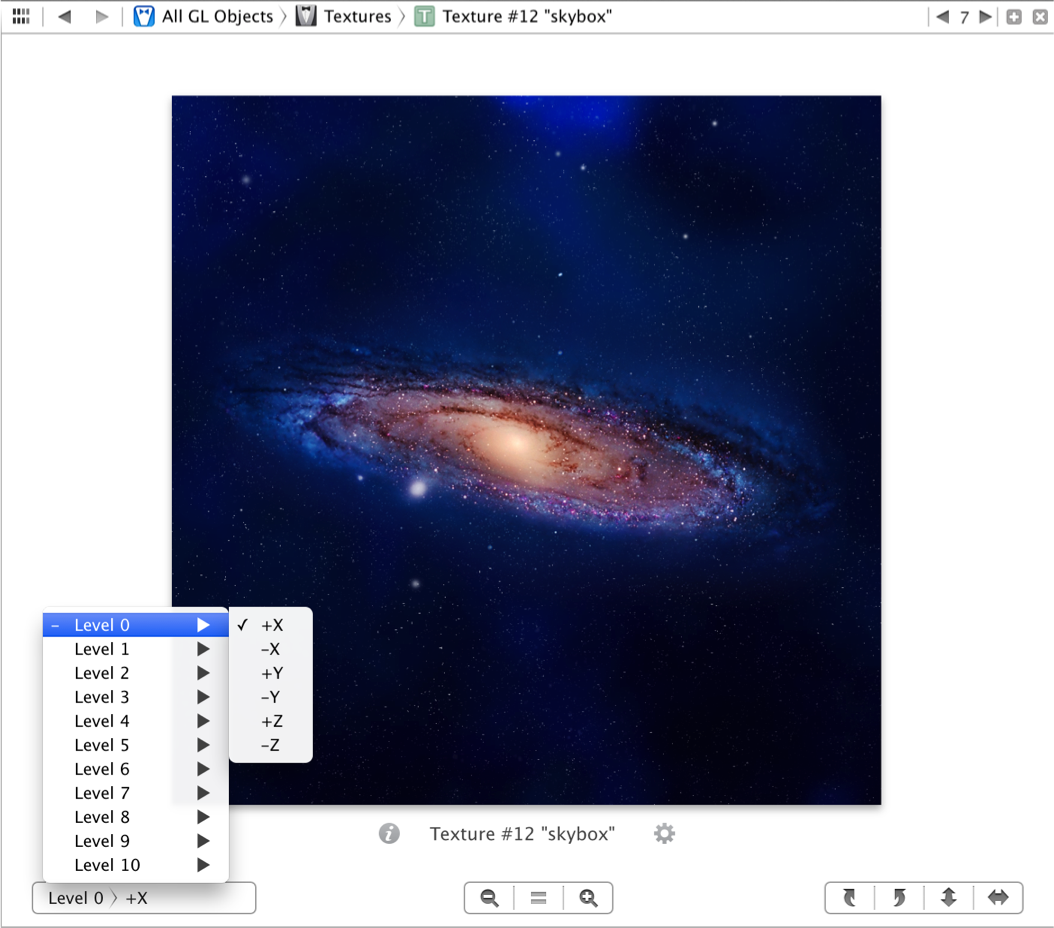
Debug Area
The debug bar provides multiple controls for navigating the captured sequence of OpenGL ES commands (shown in Figure B-12). You can use its menus to follow the hierarchy shown in the frame navigator and choose a command, or you can use the arrows and slider to move back and forth in the sequence. Press the Continue button to end frame debugging and return to running your application.
Figure B-12 OpenGL ES debug bar
The frame debugger has no debug console. Instead, Xcode offers multiple variables views, each of which provides a different summary of the current state of the OpenGL ES rendering process. Use the popup menu to choose between the available variables views, discussed in the following sections.
The All GL Objects View
The All GL Objects view, similar to the Bound GL Objects view shown on the right in Figure B-13, lists the same OpenGL ES resources as the graphical overview in the assistant editor. Unlike the graphical overview, however, this view can provide more detailed information about a resource when you expand its disclosure triangle. For example, expanding the listing for a framebuffer or buffer object shows information otherwise available only through OpenGL ES query functions such asglGetBufferParameter and glGetFramebufferAttachmentParameter. Expanding the listing for a shader program shows its status, attribute bindings, and the currently bound value for each uniform variable.
The Bound GL Objects View
The Bound GL Objects view, shown on the right in Figure B-13, behaves identically to the All GL Objects view, but lists only resources currently bound for use as of the selected OpenGL ES command in the frame navigator.
Figure B-13 Debug area with GL Context and Bound GL Objects views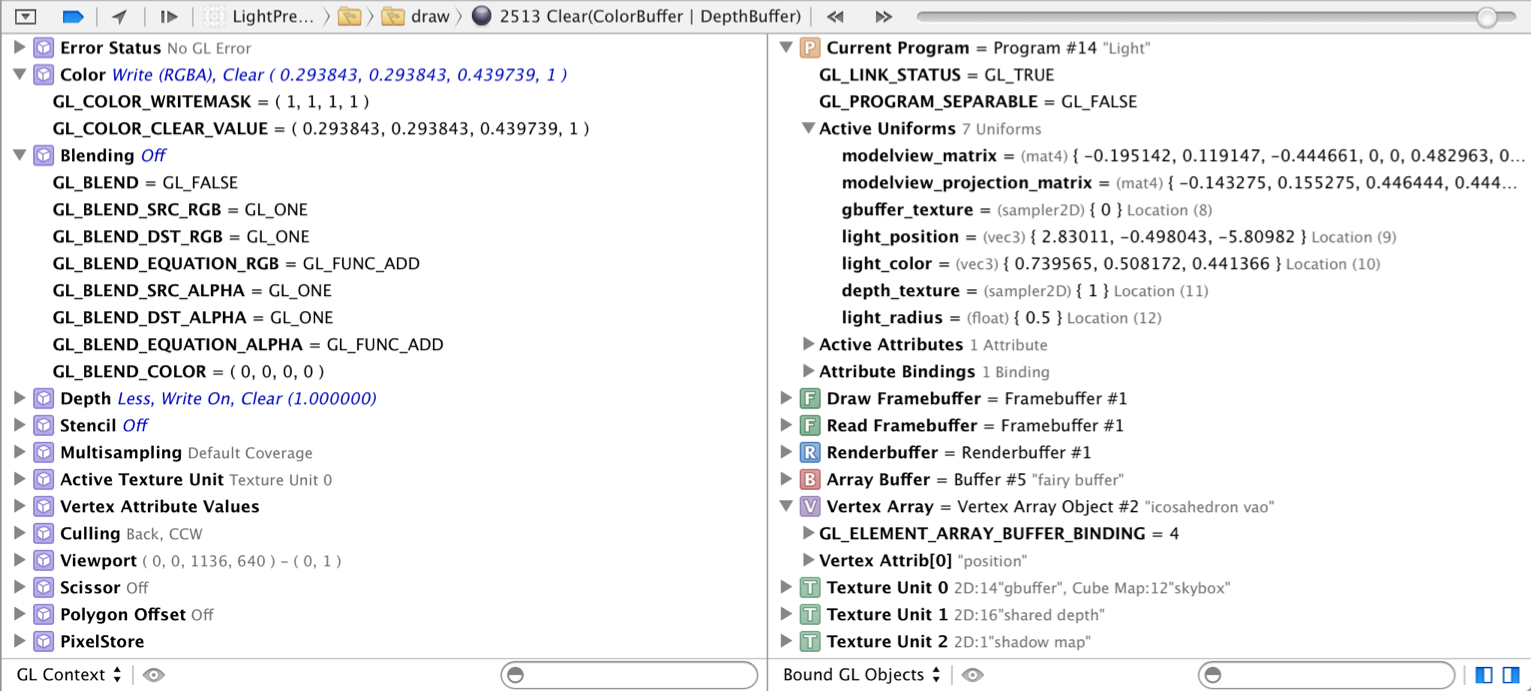
The GL Context View
The GL Context view, shown on the left in Figure B-13, lists the entire state vector of the OpenGL ES renderer, organized into functional groups. When you select a call in the frame navigator that changes OpenGL ES state, the changed values appear highlighted. For example, calling the glCullFace or glFrontFace function changes and highlights values in the Culling section of the state list. Enabling blending with the glEnable(GL_BLEND) call or changing blending parameters with theglBlendFunc function changes and highlights values in the Blending section of the state list.
The Context Info View
The Context Info view, shown on the right in Figure B-14, lists static information about the OpenGL ES renderer in use: name, version, capabilities, extensions and similar data. You can look through this data instead of writing your own code to query renderer attributes such as GL_MAX_TEXTURE_IMAGE_UNITS and GL_EXTENSIONS.
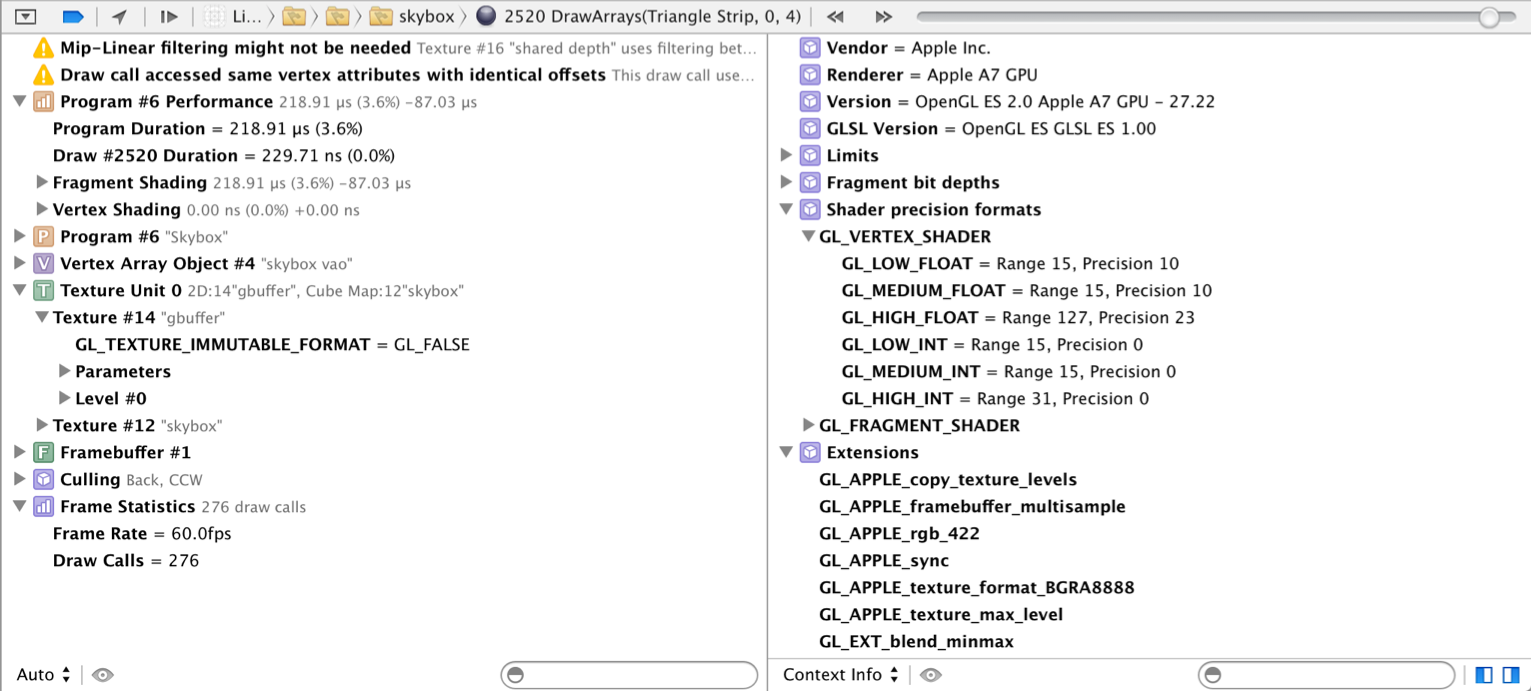
The Auto View
The Auto view, shown on the left in Figure B-14, automatically lists a subset of items normally found in the other variables views and other information appropriate to the selected call in the frame navigator. For example:
If the selected call results in an OpenGL ES error, or if Xcode has identified possible performance issues with the selected call, the view lists the errors or warnings and suggested fixes for each.
If the selected call changes part of the OpenGL ES context state, or its behavior is dependent on context state, the view automatically lists relevant items from the GL Context view.
If the selected call binds a resource or makes use of bound resources such as vertex array objects, programs, or textures, the view automatically lists relevant items from the Bound GL Objects view.
If a draw call is selected, the view lists program performance information, including the total time spent in each shader during that draw call and, if you’ve changed and recompiled shaders since capturing the frame, the difference from the baseline time spent in each shader. (Program performance information is only available when debugging on an OpenGL ES 3.0–capable device.)
In addition, this view lists aggregate statistics about frame rendering performance, including the number of draw calls and frame rate.
Xcode tools for debugging, analyzing, and tuning OpenGL ES applications are useful during all stages of development. The FPS Debug Gauge and GPU report summarize your app’s GPU performance every time you run it from Xcode, so you can quickly spot performance issues while designing and building your renderer. Once you’ve found a trouble spot, capture a frame and use Xcode’s OpenGL ES Frame Debugger interface to pinpoint rendering problems and solve performance issues.
Effectively using the Xcode OpenGL ES features requires some familiarity with Xcode’s debugging interface. For background information, read Xcode Overview.
Using the FPS Debug Gauge and GPU Report
The FPS debug gauge and accompanying GPU report, shown in Figure B-1, provide a high-level summary of your app’s OpenGL ES performance while it runs. By monitoring these displays when developing your app, you can discover performance issues as they arise and consider where to focus your tuning efforts.
Figure B-1 FPS Debug Gauge and GPU ReportNote: Some features of the FPS gauge and GPU report rely on a display link timer. If you do not use the CADisplayLink or GLKViewController classes to animate your OpenGL ES displays, the gauge and report cannot show performance relative to a target frame rate or provide accurate CPU frame time information.
The debug gauge and report contain the following displays:
FPS Gauge. Shows the current animation rate of your app, in frames per second (FPS), and a recent history of FPS readings. Click this gauge to display the GPU report in Xcode’s primary editor.
Frames Per Second. Shows the current frame rate, relative to the target frame rate set by your app (often 30 or 60 FPS). A blue arc indicates the recent range of FPS readings.
Utilization. Shows three bars, breaking down your app’s use of the different processing resources on the GPU and indicating the possible locations of performance bottlenecks in your use of graphics hardware.
The Tiler bar measures use of the GPU’s geometry processing resources. High tiler utilization can indicate performance bottlenecks in the vertex and primitive processing stages of the OpenGL ES pipeline, such as using inefficient vertex shader code or drawing an excessive number of vertices or primitives each frame.
The Renderer bar measures use of the GPU’s pixel processing resources. High renderer utilization can indicate performance bottlenecks in the fragment and pixel processing stages of the OpenGL ES pipeline, such as using inefficient fragment shader code or processing additional fragments each frame for color blending.
The Device bar shows overall GPU usage, incorporating both tiler and renderer usage.
Frame Time. Shows the time spent processing each frame on both the CPU and GPU. This graph can indicate whether your app makes effective use of CPU/GPU parallelism.
If your app spends more time in CPU processing, you may be able to improve performance by moving work to the GPU. For example, if each frame requires many similar
glDrawArraysorglDrawElementscalls, you can use hardware instancing to reduce CPU overhead. (For details, see Use Instanced Drawing to Minimize Draw Calls.)If your app spends more time in GPU processing, you may be able to improve performance by moving work to the CPU. For example, if a shader performs the same calculation with the same result for every vertex or fragment during a particular draw call, you can perform that computation once on the CPU and pass its result to the shader in a uniform variable. (See Use Uniforms or Constants Instead of Computing Values in a Shader.)
Program Performance. Only appears after you capture a frame (see Capturing and Analyzing an OpenGL ES Frame below), showing the time spent in each shader program while rendering the captured frame, both in milliseconds and as a percentage of the total frame rendering time. Expanding the listing for a program shows the draw calls made using that program and the rendering time contribution from each. Select a program in the list to view its shader source code in the assistant editor, or click the arrow icon next to a draw call to select that call in the frame navigator (see Navigator Area below).
Note: The Program Performance view only appears when debugging on devices that support OpenGL ES 3.0 (regardless of whether your app uses an OpenGL ES 3.0 or 2.0 context).
When tuning your app, you can use this graph to find opportunities for optimization. For example, if one program takes 50% of the frame rendering time, you gain more performance by optimizing it than by improving the speed of a program that accounts for only 10% of frame time. Though this view organizes frame time by shader program, remember that improving your shader algorithms isn’t the only way to optimize your app’s performance—for example, you can also reduce the number of draw calls that use a costly shader program, or reduce the number of fragments processed by a slow fragment shader.
Problems & Solutions. Only appears after Xcode analyzes a frame capture (see Capturing and Analyzing an OpenGL ES Frame), this area lists possible issues found during analysis and recommendations for improving performance.
When you make changes to a GLSL shader program in a captured frame (see Editing Shader Programs below), the Frame Time and Program Performance graphs expand to show both the baseline rendering time of the frame as originally captured and the current rendering time using your edited shaders.
Capturing and Analyzing an OpenGL ES Frame
For a detailed look at your app’s OpenGL ES usage, capture the sequence of OpenGL ES commands used to render a single frame of animation. Xcode offers several ways to begin a frame capture:
Manual capture. While running your app in Xcode, click the camera icon in the debug bar (shown in Figure B-2) or choose Capture OpenGL ES Frame from the Debug menu.
Figure B-2 Debug Bar with Capture OpenGL ES Frame buttonNote: The Capture OpenGL ES Frame button automatically appears only if your project links against the OpenGL ES or Sprite Kit framework. You can choose whether it appears for other projects by editing the active scheme. (SeeAbout the Scheme Editing Dialog.)
Breakpoint action. Choose Capture OpenGL ES Frame as an action for any breakpoint. When the debugger reaches a breakpoint with this action, Xcode automatically captures a frame. (See Setting Breakpoint Actions and Options.) If you use this action with an OpenGL ES Error breakpoint while developing your app (see Adding an OpenGL ES Error Breakpoint), you can use the OpenGL ES Frame Debugger to investigate the causes of OpenGL ES errors whenever they occur.
OpenGL ES event marker. Programmatically trigger a frame capture by inserting an event marker in the OpenGL ES command stream. The following command inserts such a marker:
glInsertEventMarkerEXT(0, "com.apple.GPUTools.event.debug-frame")
When the OpenGL ES client reaches this marker, it finishes rendering the frame, then Xcode automatically captures the entire sequence of commands used to render that frame.
After Xcode has captured the frame, it shows the OpenGL ES Frame Debugger interface. Use this interface to inspect the sequence of OpenGL ES commands that render the frame and examine OpenGL ES resources, as discussed in Touring the OpenGL ES Frame Debugger.
In addition, Xcode can perform an automated analysis of your app’s OpenGL ES usage to determine which parts of your renderer and shader architecture can benefit most from performance optimizations. To use this option, click the Analyze button at the top of the GPU report (shown at the top right in Figure B-1).
When you click the Analyze button, Xcode captures a frame (if one hasn’t been captured already), then runs your rendering code through a series of experiments using the attached iOS device. For example, to see if your rendering speed is limited by texture sizes, Xcode runs the captured sequence of OpenGL ES commands both with the texture data your app submitted to the GPU and with a size-reduced texture set. After Xcode finishes its analysis, the Problems & Solutions area of the GPU report lists any issues it found and suggestions for possible performance improvements.
Touring the OpenGL ES Frame Debugger
After Xcode captures a frame, it automatically reconfigures its interface for OpenGL ES debugging. The OpenGL ES Frame Debugger interface modifies several areas of the Xcode workspace window to provide information about the OpenGL ES rendering process, as shown in Figure B-3 and Figure B-4 and summarized below. (The frame debugger does not use the inspector or library panes, so you may wish to hide Xcode’s utility area during OpenGL ES debugging.)
Figure B-3 Frame debugger examining draw calls and resourcesFigure B-4 Frame debugger examining shader program performance and analysis resultsNavigator Area
In the OpenGL ES frame debugger interface, the debug navigator is replaced by the OpenGL ES frame navigator. This navigator shows the OpenGL ES commands that render the captured frame, organized sequentially or according to their associated shader program. Use the Frame View Options popup menu at the top of the frame navigator to switch between view styles.
Figure B-5 View Frame By popup menu in navigatorView Frame By Call
View the captured frame by call when you want to study OpenGL ES commands in sequence to pinpoint errors, diagnose rendering problems, or identify common performance issues. In this mode, the frame navigator lists commands in the order your app called them. Error or warning icons appear next to commands that result in OpenGL ES errors or that may indicate performance issues.
You can add structure to this list by using the glPushGroupMarkerEXT and glPopGroupMarkerEXT functions to annotate groups of OpenGL ES commands—these groups appear as folders you can expand or collapse to show more or less detail. (For details, see Annotate Your OpenGL ES Code for Informative Debugging and Profiling.) You can also expand an OpenGL ES command to show a stack trace indicating where in your application code the command was issued.
Use the context menu to choose whether to abbreviate command names and which commands, groups, and warnings to show. Use the flag icon at the bottom of the navigator to switch between showing all OpenGL ES commands and showing only those which draw into the framebuffer.
Clicking an OpenGL ES command in the list navigates to that point in the OpenGL ES command sequence, affecting the contents of other areas of the frame debugger interface, as discussed below, and showing the effects of the OpenGL ES calls up to that point on the attached device’s display.
View Frame By Program
View the captured frame by program when you want to analyze the GPU time spent on each shader program and draw command.
Expand the listing for a program to see the time contribution from each shader in the program and each draw call. Expand the listing for a draw call to show a stack trace indicating where in your application code that command was issued.
Use the context menu to refine the display—you can choose whether programs are sorted by their time contributions and whether timing information is displayed as a percentage of the total rendering time.
Clicking a program or shader shows the corresponding GLSL source code in the primary editor. Clicking an OpenGL ES command navigates to that point in the frame capture sequence.
Note: The View Frame By Program option is only available when debugging on devices that support OpenGL ES 3.0 (regardless of whether your app uses an OpenGL ES 3.0 or 2.0 context). On other devices, the Frame View Options popup menu is disabled.
Editor Area
When working with a frame capture, you use the primary editor to preview the framebuffer being rendered to, and the assistant editor to examine OpenGL ES resources and edit GLSL shader programs. By default, the assistant editor shows a graphical overview of all resources currently owned by the OpenGL ES context, as shown in Figure B-3. Use the assistant editor’s jump bar to show only those resources bound for use as of the call selected in the frame navigator, or to select an individual resource for further inspection. You can also double-click a resource in the overview to inspect it. When you select a resource, the assistant editor changes to a format suited for tasks appropriate to that resource’s type.
Previewing Framebuffer Contents
The primary editor shows the contents of the framebuffer as rendered by the draw call currently selected in the frame navigator. (If the selected OpenGL ES command in the frame navigator is not a drawing command—for example, a command that sets state such as glUseProgram—the framebuffer reflects the rendering done by the most recent draw call prior to the selection.) You can also navigate the sequence of OpenGL ES commands using the jump bar at the top of the primary editor.
The editor shows a preview for each framebuffer attachment currently bound for drawing. For example, most approaches to 3D rendering use a framebuffer with attachments for both color and depth, as illustrated in . Use the controls in the lower left of the editor to choose which framebuffer attachments are currently shown. Clicking the info button, left of each framebuffer attachment’s name, shows a popover detailing the attachment’s properties, as shown in Figure B-6. Click the settings button, right of the framebuffer attachment’s name, to show a popover with controls that adjust the preview image. For example, you can use these controls to make a certain range of Z values in a depth buffer more visible in its grayscale preview, as shown in Figure B-7.
Figure B-7 Framebuffer settings popoverEach framebuffer attachment preview also shows a green wireframe highlighting the effect of the current draw call (as illustrated in Figure B-3). Use the context menu in a preview image to choose whether the highlight appears in the preview or on the display of the attached device.
Editing Shader Programs
When you select a shader program in the assistant editor’s jump bar or resource overview, the assistant editor shows the GLSL source code for that program’s fragment shader (as shown in Figure B-8). When you select a program in the frame navigator (seeView Frame By Program), the primary editor shows the program’s fragment shader and the assistant editor shows its vertex shader. In any editor showing a fragment shader, you can use the jump bar to switch to its counterpart vertex shader, and vice versa.
Figure B-8 GLSL shader source editor with update buttonEach line of the shader source code is highlighted in the right margin with a bar representing its relative contribution to rendering time. Use these to focus your shader optimization efforts—if a few lines account for a greater share of rendering time, look into faster alternatives for those lines. (For shader performance tips, see Best Practices for Shaders.)
You can make changes to the shader source code in the editor. Then, click the Update button below the editor (shown in Figure B-8) to recompile the shader program and see its effects on the captured frame. If compiling the shader results in error or warning messages from the GLSL compiler, Xcode annotates the shader source code for each issue. The recompiled shader program remains in use on the device, so you can resume running your app. Click the Continue button in the debug bar to see your shader changes in action.
Inspecting Vertex Data
When you inspect an array buffer, the assistant editor shows the contents of the buffer (see Figure B-9). Because a buffer in OpenGL ES memory has no defined format, you use the pop-up menus at the bottom of the editor to choose how its contents appear (for example, as 32-bit integers or floating-point values, or as twice as many 16-bit integers or half-float values), and how many columns Xcode uses to display the data.
Figure B-9 Assistant editor previewing array buffer contentsA vertex array object (VAO) encapsulates one or more data buffers in OpenGL ES memory and the attribute bindings used for supplying vertex data from the buffers to a shader program. (For details on using VAOs, see Consolidate Vertex Array State Changes Using Vertex Array Objects.) Because the VAO bindings include information about the format of the buffers’ contents, inspecting a VAO shows its contents as interpreted by OpenGL ES (see Figure B-10).
Figure B-10 Assistant editor previewing vertex array objectViewing Textures or Renderbuffers
When you inspect a texture or renderbuffer, the assistant editor shows an image preview of its contents. You can use the same controls found in the primary editor to get more information about the texture object or renderbuffer and to adjust the image preview. For textures, you can use an additional control in the lower left corner of the assistant editor to preview each mipmap level of the texture and (if applicable) each face of a cube map texture (as shown in Figure B-11).
Figure B-11 Assistant editor previewing cube map textureDebug Area
The debug bar provides multiple controls for navigating the captured sequence of OpenGL ES commands (shown in Figure B-12). You can use its menus to follow the hierarchy shown in the frame navigator and choose a command, or you can use the arrows and slider to move back and forth in the sequence. Press the Continue button to end frame debugging and return to running your application.
Figure B-12 OpenGL ES debug barThe frame debugger has no debug console. Instead, Xcode offers multiple variables views, each of which provides a different summary of the current state of the OpenGL ES rendering process. Use the popup menu to choose between the available variables views, discussed in the following sections.
The All GL Objects View
The All GL Objects view, similar to the Bound GL Objects view shown on the right in Figure B-13, lists the same OpenGL ES resources as the graphical overview in the assistant editor. Unlike the graphical overview, however, this view can provide more detailed information about a resource when you expand its disclosure triangle. For example, expanding the listing for a framebuffer or buffer object shows information otherwise available only through OpenGL ES query functions such asglGetBufferParameter and glGetFramebufferAttachmentParameter. Expanding the listing for a shader program shows its status, attribute bindings, and the currently bound value for each uniform variable.
The Bound GL Objects View
The Bound GL Objects view, shown on the right in Figure B-13, behaves identically to the All GL Objects view, but lists only resources currently bound for use as of the selected OpenGL ES command in the frame navigator.
Figure B-13 Debug area with GL Context and Bound GL Objects viewsThe GL Context View
The GL Context view, shown on the left in Figure B-13, lists the entire state vector of the OpenGL ES renderer, organized into functional groups. When you select a call in the frame navigator that changes OpenGL ES state, the changed values appear highlighted. For example, calling the glCullFace or glFrontFace function changes and highlights values in the Culling section of the state list. Enabling blending with the glEnable(GL_BLEND) call or changing blending parameters with theglBlendFunc function changes and highlights values in the Blending section of the state list.
The Context Info View
The Context Info view, shown on the right in Figure B-14, lists static information about the OpenGL ES renderer in use: name, version, capabilities, extensions and similar data. You can look through this data instead of writing your own code to query renderer attributes such as GL_MAX_TEXTURE_IMAGE_UNITS and GL_EXTENSIONS.
The Auto View
The Auto view, shown on the left in Figure B-14, automatically lists a subset of items normally found in the other variables views and other information appropriate to the selected call in the frame navigator. For example:
If the selected call results in an OpenGL ES error, or if Xcode has identified possible performance issues with the selected call, the view lists the errors or warnings and suggested fixes for each.
If the selected call changes part of the OpenGL ES context state, or its behavior is dependent on context state, the view automatically lists relevant items from the GL Context view.
If the selected call binds a resource or makes use of bound resources such as vertex array objects, programs, or textures, the view automatically lists relevant items from the Bound GL Objects view.
If a draw call is selected, the view lists program performance information, including the total time spent in each shader during that draw call and, if you’ve changed and recompiled shaders since capturing the frame, the difference from the baseline time spent in each shader. (Program performance information is only available when debugging on an OpenGL ES 3.0–capable device.)
In addition, this view lists aggregate statistics about frame rendering performance, including the number of draw calls and frame rate.
- Xcode OpenGL ES Tools Overview
- OpenGL ES 00 - Xcode Project Set Up
- OpenGL ES xcode模板的安装
- Using Xcode OpenGL ES Frame Capture
- Using Xcode OpenGL ES Frame Capture
- Xcode Overview
- OpenGL Overview
- OpenGL Overview
- OpenGL ES系列之0 – 建立Xcode项目
- OpenGL ES系列之0 – 建立Xcode项目
- OpenGL ES系列之0 – 建立Xcode项目
- OpenGL ES系列之0 – 建立Xcode项目
- OpenGL ES系列之0 – 建立Xcode项目
- OPENGL ES
- OpenGL ES
- OpenGL ES
- opengl es
- OpenGL ES
- 位运算状态压缩——飞行员兄弟的冰箱
- Spark 1.6发布的新功能
- 【提高】面试五
- spring 事务配置注解(自己随便写写)
- css之父子选择器
- Xcode OpenGL ES Tools Overview
- 自动换行的button
- Error: linker command failed with exit code 1 (use -v to see invocation)
- BZOJ3667: Rabin-Miller算法
- linux 中mmap的用法
- iOS设计模式-工厂方法
- vmware中centos虚机ping不同外网问题解决
- 变化的你--写给宝宝
- ZooKeeper管理员指南——部署与管理ZooKeeper