JVM:如何分析线程堆栈
来源:互联网 发布:c语言的一些基础指令 编辑:程序博客网 时间:2024/05/22 02:00
This article will teach you how to analyze a JVM Thread Dump and pinpoint the root cause of your problem(s). From my perspective, Thread Dump analysis is the most important skillset to master for any individual involved in Java EE production support. The amount of information that you can derive from Thread Dump snapshots is often much beyond than what you can think of.
My goal is to share with you my knowledge on Thread Dump analysis that I accumulated over the last 10 years e.g. hundreds of Thread Dump analysis cycles with dozens of common problem patterns across many JVM versions and JVM vendors.
Please bookmark this page and stay tuned for weekly articles.
Please also feel free to share this Thread Dump training plan with your work colleagues and friends.
Sounds good, I really need to improve my Thread Dump skills… so where do we start?
What I’m proposing to you is a complete Thread Dump training plan. The following items will be covered. I will also provide you with real life Thread Dump examples that you can study and understand.
1) Thread Dump overview & fundamentals
2) Thread Dump generation techniques and available tools
3) Thread Dump format differences between Sun HotSpot, IBM JRE and Oracle JRockit
4) Thread Stack Trace explanation and interpretation
5) Thread Dump analysis and correlation techniques
6) Thread Dump common problem patterns (Thread race, deadlock, hanging IO calls, garbage collection / OutOfMemoryError problems, infinite looping etc.)
7) Thread Dump examples via real life case studies
I really hope this Thread Dump analysis training plan will be beneficial for you so please stay tuned for weekly updates and articles!
But what if I still have questions or still struggling to understand these training articles?
Don’t worry and please consider me as your trainer. I strongly encourage you to ask me any question on Thread Dump (remember, there are no stupid questions) so I propose the following options to you for free; simply chose the communication model that you are more comfortable with:
1) Submit your Thread Dump related question(s) by posting your comment(s) below the article (please feel free to remain Anonymous)
2) Submit your Thread Dump data to the Root Cause Analysis forum
3) Email me your Thread Dump related question(s) @phcharbonneau@hotmail.com
Can I send you my Thread Dump data from my production environment / servers?
Yes, please feel free to send me your generated Thread Dump data via email or Root Cause Analysis forum if you wish to discuss the root cause of your problem(s). Real life Thread Dump analysis is always the best way to learn.
I really hope that you will enjoy and share this Thread Dump analysis training plan. I will do my very best to provide you with quality material and answers to any question.
Before going deeper into Thread Dump analysis and problem patterns, it is very important that you understand the fundamentals. The post will cover the basics and allow you to better your JVM and middleware interaction with your Java EE container.
Java VM overview
The Java virtual machine is really the foundation of any Java EE platform. This is where your middleware and applications are deployed and active.
The JVM provides the middleware software and your Java / Java EE program with:
– A runtime environment for your Java / Java EE program (bytecode format)
– Several program features and utilities (IO facilities, data structure, Threads management, security, monitoring etc.)
– Dynamic memory allocation and management via the garbage collector
Your JVM can reside on many OS (Solaris, AIX, Windows etc.) and depending of your physical server specifications, you can install 1…n JVM processes per physical / virtual server.
JVM and Middleware software interactions
Find below a diagram showing you a high level interaction view between the JVM, middleware and application(s).
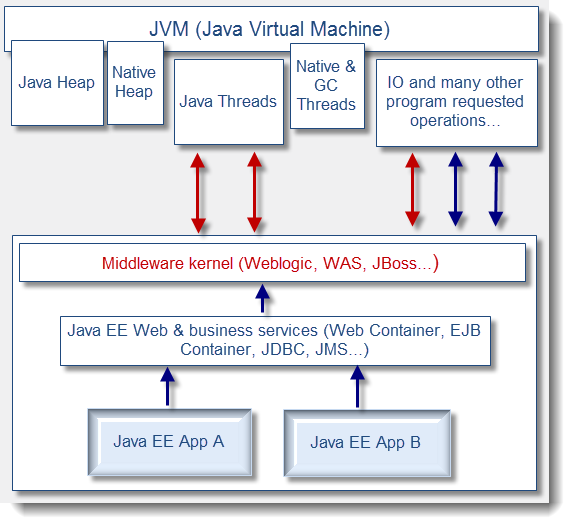
This is showing you a typical and simple interaction diagram between the JVM, middleware and application. As you can see, the Threads allocation for a standard Java EE application are done mainly between the middleware kernel itself and JVM (there are some exceptions when application itself or some APIs create Threads directly but this is not common and must be done very carefully).
Also, please note that certain Threads are managed internally within the JVM itself such as GC (garbage collection) Threads in order to handle concurrent garbage collections.
Since most of the Thread allocations are done by the Java EE container, it is important that you understand and recognize the Thread Stack Trace and identify it properly from the Thread Dump data. This will allow you to understand quickly the type of request that the Java EE container is attempting to execute.
From a Thread Dump analysis perspective, you will learn how to differentiate between the different Thread Pools found from the JVM and identify the request type.
This last section will provide you with an overview of what is a JVM Thread Dump for the HotSpot VM and the different Threads that you will find. Detail for the IBM VM Thread Dump format will be provided in the part 4.
Please note that you will find the Thread Dump sample used for this article from the root cause analysis forum.
JVM Thread Dump – what is it?
A JVM Thread Dump is a snapshot taken at a given time which provides you with a complete listing of all created Java Threads.
Each individual Java Thread found gives you information such as:
– Thread name; often used by middleware vendors to identify the Thread Id along with its associated Thread Pool name and state (running, stuck etc.)
– Thread type & priority ex: daemon prio=3 ** middleware softwares typically create their Threads as daemon meaning their Threads are running in background; providing services to its user e.g. your Java EE application **
– Java Thread ID ex: tid=0x000000011e52a800 ** This is the Java Thread Id obtained via java.lang.Thread.getId() and usually implemented as an auto-incrementing long 1..n**
– Native Thread ID ex: nid=0x251c** Crucial information as this native Thread Id allows you to correlate for example which Threads from an OS perspective are using the most CPU within your JVM etc. **
– Java Thread State and detail ex: waiting for monitor entry [0xfffffffea5afb000] java.lang.Thread.State: BLOCKED (on object monitor)
** Allows to quickly learn about Thread state and its potential current blocking condition **
– Java Thread Stack Trace; this is by far the most important data that you will find from the Thread Dump. This is also where you will spent most of your analysis time since the Java Stack Trace provides you with 90% of the information that you need in order to pinpoint root cause of many problem pattern types as you will learn later in the training sessions
– Java Heap breakdown; starting with HotSpot VM 1.6, you will also find at the bottom of the Thread Dump snapshot a breakdown of the HotSpot memory spaces utilization such as your Java Heap (YoungGen, OldGen) & PermGen space. This is quite useful when excessive GC is suspected as a possible root cause so you can do out-of-the-box correlation with Thread data / patterns found
1Heap2PSYoungGen total 466944K, used 178734K [0xffffffff45c00000, 0xffffffff70800000, 0xffffffff70800000)3eden space 233472K, 76% used [0xffffffff45c00000,0xffffffff50ab7c50,0xffffffff54000000)4from space 233472K, 0% used [0xffffffff62400000,0xffffffff62400000,0xffffffff70800000)5to space 233472K, 0% used [0xffffffff54000000,0xffffffff54000000,0xffffffff62400000)6PSOldGen total 1400832K, used 1400831K [0xfffffffef0400000, 0xffffffff45c00000, 0xffffffff45c00000)7object space 1400832K, 99% used [0xfffffffef0400000,0xffffffff45bfffb8,0xffffffff45c00000)8PSPermGen total 262144K, used 248475K [0xfffffffed0400000, 0xfffffffee0400000, 0xfffffffef0400000)9object space 262144K, 94% used [0xfffffffed0400000,0xfffffffedf6a6f08,0xfffffffee0400000)Thread Dump breakdown overview
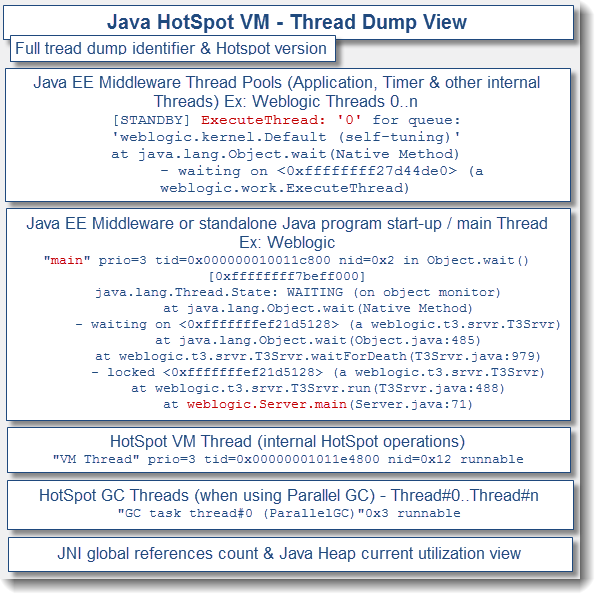
In order for you to better understand, find below a diagram showing you a visual breakdown of a HotSpot VM Thread Dump and its common Thread Pools found:

For now, find below a detailed explanation for each Thread Dump section as per our sample HotSpot Thread Dump:
# Full thread dump identifier
This is basically the unique keyword that you will find in your middleware / standalong Java standard output log once you generate a Thread Dump (ex: via kill -3 <PID> for UNIX). This is the beginning of the Thread Dump snapshot data.
1Full thread dump Java HotSpot(TM) 64-Bit Server VM (20.0-b11 mixed mode):# Java EE middleware, third party & custom application Threads
This portion is the core of the Thread Dump and where you will typically spend most of your analysis time. The number of Threads found will depend on your middleware software that you use, third party libraries (that might have its own Threads) and your application (if creating any custom Thread, which is generally not a best practice).
In our sample Thread Dump, Weblogic is the middleware used. Starting with Weblogic 9.2, a self-tuning Thread Pool is used with unique identifier “’weblogic.kernel.Default (self-tuning)”
1"[STANDBY] ExecuteThread: '414' for queue: 'weblogic.kernel.Default (self-tuning)'" daemon prio=3 tid=0x000000010916a800 nid=0x2613 in Object.wait() [0xfffffffe9edff000]2 java.lang.Thread.State: WAITING (on object monitor)3 at java.lang.Object.wait(Native Method)4 - waiting on <0xffffffff27d44de0> (a weblogic.work.ExecuteThread)5 at java.lang.Object.wait(Object.java:485)6 at weblogic.work.ExecuteThread.waitForRequest(ExecuteThread.java:160)7 - locked <0xffffffff27d44de0> (a weblogic.work.ExecuteThread)8 at weblogic.work.ExecuteThread.run(ExecuteThread.java:181)# HotSpot VM Thread
This is an internal Thread managed by the HotSpot VM in order to perform internal native operations. Typically you should not worry about this one unless you see high CPU(via Thread Dump & prstat / native Thread id correlation).
1"VM Periodic Task Thread" prio=3 tid=0x0000000101238800 nid=0x19 waiting on condition# HotSpot GC Thread
When using HotSpot parallel GC (quite common these days when using multi physical cores hardware), the HotSpot VM create by default or as per your JVM tuning a certain # of GC Threads. These GC Threads allow the VM to perform its periodic GC cleanups in a parallel manner, leading to an overall reduction of the GC time; at the expense of increased CPU utilization.
1"GC task thread#0 (ParallelGC)" prio=3 tid=0x0000000100120000 nid=0x3 runnable2"GC task thread#1 (ParallelGC)" prio=3 tid=0x0000000100131000 nid=0x4 runnable3………………………………………………………………………………………………………………………………………………………………This is crucial data as well since when facing GC related problems such as excessive GC, memory leaks etc, you will be able to correlate any high CPU observed from the OS / Java process(es) with these Threads using their native id value (nid=0x3). You will learn how to identify and confirm this problem is future articles.
# JNI global references count
JNI (Java Native Interface) global references are basically Object references from the native code to a Java object managed by the Java garbage collector. Its role is to prevent collection of an object that is still in use by native code but technically with no “live” references in the Java code.
It is also important to keep an eye on JNI references in order to detect JNI related leaks. This can happen if you program use JNI directly or using third party tools like monitoring tools which are prone to native memory leaks.
1JNI global references: 1925# Java Heap utilization view
This data was added back to JDK 1 .6 and provides you with a short and fast view of your HotSpot Heap. I find it quite useful when troubleshooting GC related problems along with HIGH CPU since you get both Thread Dump & Java Heap in a single snapshot allowing you to determine (or to rule out) any pressure point in a particular Java Heap memory space along with current Thread computing currently being done at that time. As you can see in our sample Thread Dump, the Java Heap OldGen is maxed out!
1Heap2 PSYoungGen total 466944K, used 178734K [0xffffffff45c00000, 0xffffffff70800000, 0xffffffff70800000)3 eden space 233472K, 76% used [0xffffffff45c00000,0xffffffff50ab7c50,0xffffffff54000000)4 from space 233472K, 0% used [0xffffffff62400000,0xffffffff62400000,0xffffffff70800000)5 to space 233472K, 0% used [0xffffffff54000000,0xffffffff54000000,0xffffffff62400000)6 PSOldGen total 1400832K, used 1400831K [0xfffffffef0400000, 0xffffffff45c00000, 0xffffffff45c00000)7 object space 1400832K, 99% used [0xfffffffef0400000,0xffffffff45bfffb8,0xffffffff45c00000)8 PSPermGen total 262144K, used 248475K [0xfffffffed0400000, 0xfffffffee0400000, 0xfffffffef0400000)9 object space 262144K, 94% used [0xfffffffed0400000,0xfffffffedf6a6f08,0xfffffffee0400000)I hope this article has helped to understand the basic view of a HotSpot VM Thread Dump.The next article will provide you this same Thread Dump overview and breakdown for the IBM VM.
Please feel free to post any comment or question.
Reference: How to analyze Thread Dump – part 1, How to analyze Thread Dump – Part2: JVM Overview & How to analyze Thread Dump – Part 3: HotSpot VM from our JCG partner Pierre-Hugues Charbonneau at the Java EE Support Patterns & Java Tutorial blog.

YiHunter
翻译于 1年前
2人顶
顶 翻译的不错哦!
YiHunter
翻译于 1年前
3人顶
顶 翻译的不错哦!
YiHunter
翻译于 1年前
2人顶
顶 翻译的不错哦!
YiHunter
翻译于 1年前
3人顶
顶 翻译的不错哦!

leoxu
翻译于 1年前
3人顶
顶 翻译的不错哦!
其它翻译版本(1)YiHunter
翻译于 1年前
3人顶
顶 翻译的不错哦!
leoxu
翻译于 1年前
2人顶
顶 翻译的不错哦!
leoxu
翻译于 1年前
2人顶
顶 翻译的不错哦!
leoxu
翻译于 1年前
1人顶
顶 翻译的不错哦!
YiHunter
翻译于 1年前
1人顶
顶 翻译的不错哦!
其它翻译版本(1)YiHunter
翻译于 1年前
1人顶
顶 翻译的不错哦!
其它翻译版本(1)leoxu
翻译于 1年前
1人顶
顶 翻译的不错哦!
leoxu
翻译于 1年前
0人顶
顶 翻译的不错哦!
- JVM:如何分析线程堆栈
- JVM:如何分析线程堆栈
- JVM:如何分析线程堆栈
- JVM:如何分析线程堆栈
- 分析jvm线程堆栈
- JVM:如何分析线程堆栈 请大神分析求解
- 分析JVM的线程堆栈以及如何从堆栈信息中
- JVM 线程堆栈分析过程详解
- JVM 线程堆栈分析过程详解
- JVM 线程堆栈分析过程详解
- 如何分析jvm dump线程
- 通过JVM堆栈分析线程出现大量异常的原因
- Java线程堆栈分析
- 线程堆栈分析
- 如何进行堆栈分析
- JVM的堆栈 触发和分析
- Java问题定位之如何借助线程堆栈进行问题分析
- jvm堆栈
- Ubuntu14.04安装搜狗输入法
- javascript获取指定链接GET参数函数
- copy与mutableCopy
- 单例模式
- 面试题
- JVM:如何分析线程堆栈
- Base64算法的编程使用
- java序列化
- 常见机器学习方法
- ionic 集成支付插件
- eclipse中egit插件使用
- ThinkPHP - 模型
- 单例整理
- HDU 1710 Binary Tree Traversals(已知先序中序求后序)