Spring Cloud Sleuth使用简介
来源:互联网 发布:入骨相思知不知 第五期 编辑:程序博客网 时间:2024/05/29 03:55
Spring-Cloud
Spring Cloud为开发者提供了在分布式系统(如配置管理、服务发现、断路器、智能路由、微代理、控制总线、一次性Token、全局锁、决策竞选、分布式会话和集群状态)操作的开发工具。使用SpringCloud开发者可以快速实现上述这些模式。
SpringCloud Sleuth
Distributed tracing for Spring Cloud applications, compatiblewith Zipkin, HTrace and log-based(e.g. ELK)tracing.
Spring-Cloud-Sleuth是Spring Cloud的组成部分之一,为SpringCloud应用实现了一种分布式追踪解决方案,其兼容了Zipkin, HTrace和log-based追踪
术语(Terminology)
Span:基本工作单元,例如,在一个新建的span中发送一个RPC等同于发送一个回应请求给RPC,span通过一个64位ID唯一标识,trace以另一个64位ID表示,span还有其他数据信息,比如摘要、时间戳事件、关键值注释(tags)、span的ID、以及进度ID(通常是IP地址)
span在不断的启动和停止,同时记录了时间信息,当你创建了一个span,你必须在未来的某个时刻停止它。
Trace:一系列spans组成的一个树状结构,例如,如果你正在跑一个分布式大数据工程,你可能需要创建一个trace。
Annotation:用来及时记录一个事件的存在,一些核心annotations用来定义一个请求的开始和结束
- cs - Client Sent -客户端发起一个请求,这个annotion描述了这个span的开始
- sr - Server Received -服务端获得请求并准备开始处理它,如果将其sr减去cs时间戳便可得到网络延迟
- ss - Server Sent -注解表明请求处理的完成(当请求返回客户端),如果ss减去sr时间戳便可得到服务端需要的处理请求时间
- cr - Client Received -表明span的结束,客户端成功接收到服务端的回复,如果cr减去cs时间戳便可得到客户端从服务端获取回复的所有所需时间
将Span和Trace在一个系统中使用Zipkin注解的过程图形化:

每个颜色的注解表明一个span(总计7个spans,从A到G),如果在注解中有这样的信息:
Trace Id = X
Span Id = D
Client Sent
这就表明当前span将Trace-Id设置为X,将Span-Id设置为D,同时它还表明了ClientSent事件。
spans 的parent/child关系图形化:

目的(Purpose)
基于Zipkin的分布式追踪
总计11个spans,如果在Zipkin中查看traces将看到如下图:

但如果你选取一个特殊的trace你将看到8个spans:

当选取一个特殊trace时你会看到合并的spans,这意味着如果有两个spans使用客户端接收发送/服务端接收发送注解发送至Zipkin时,他们将表现为一个单独的span
在展示Span和Trace图形化的图片中有20个颜色标签,Zipkin又是如何接收10个spans的呢?
- 2个span A标签表明span的开始和结束,接近结束时一个单独的span发送给Zipkin
- 4个span B标签实际上是一个有4个注解的单独span,然而这个span是由两个分离的实例组成的,一个由 service 1发出,一个由service 2发出,因此实际上两个span实例是发送到Zipkin并在那合并
- 2个span C标签表明span的开始和结束,接近结束时一个单独的span发送给Zipkin
- 4个span D标签实际上是一个有4个注解的单独span,然而这个span是由两个分离的实例组成的,一个由 service 2发出,一个由service 3发出,因此实际上两个span实例是发送到Zipkin并在那合并
- 2个span E标签表明span的开始和结束,接近结束时一个单独的span发送给Zipkin
- 4个span F标签实际上是一个有4个注解的单独span,然而这个span是由两个分离的实例组成的,一个由 service 2发出,一个由service 4发出,因此实际上两个span实例是发送到Zipkin并在那合并
- 2个span G标签表明span的开始和结束,接近结束时一个单独的span发送给Zipkin
因此1个span来自A,2个span来自B,1个span来自C,2个span来自D,1个span来自E,2个span来自F,1个来自G,总计10个spans。
Zipkin中的依赖图:

Log相关
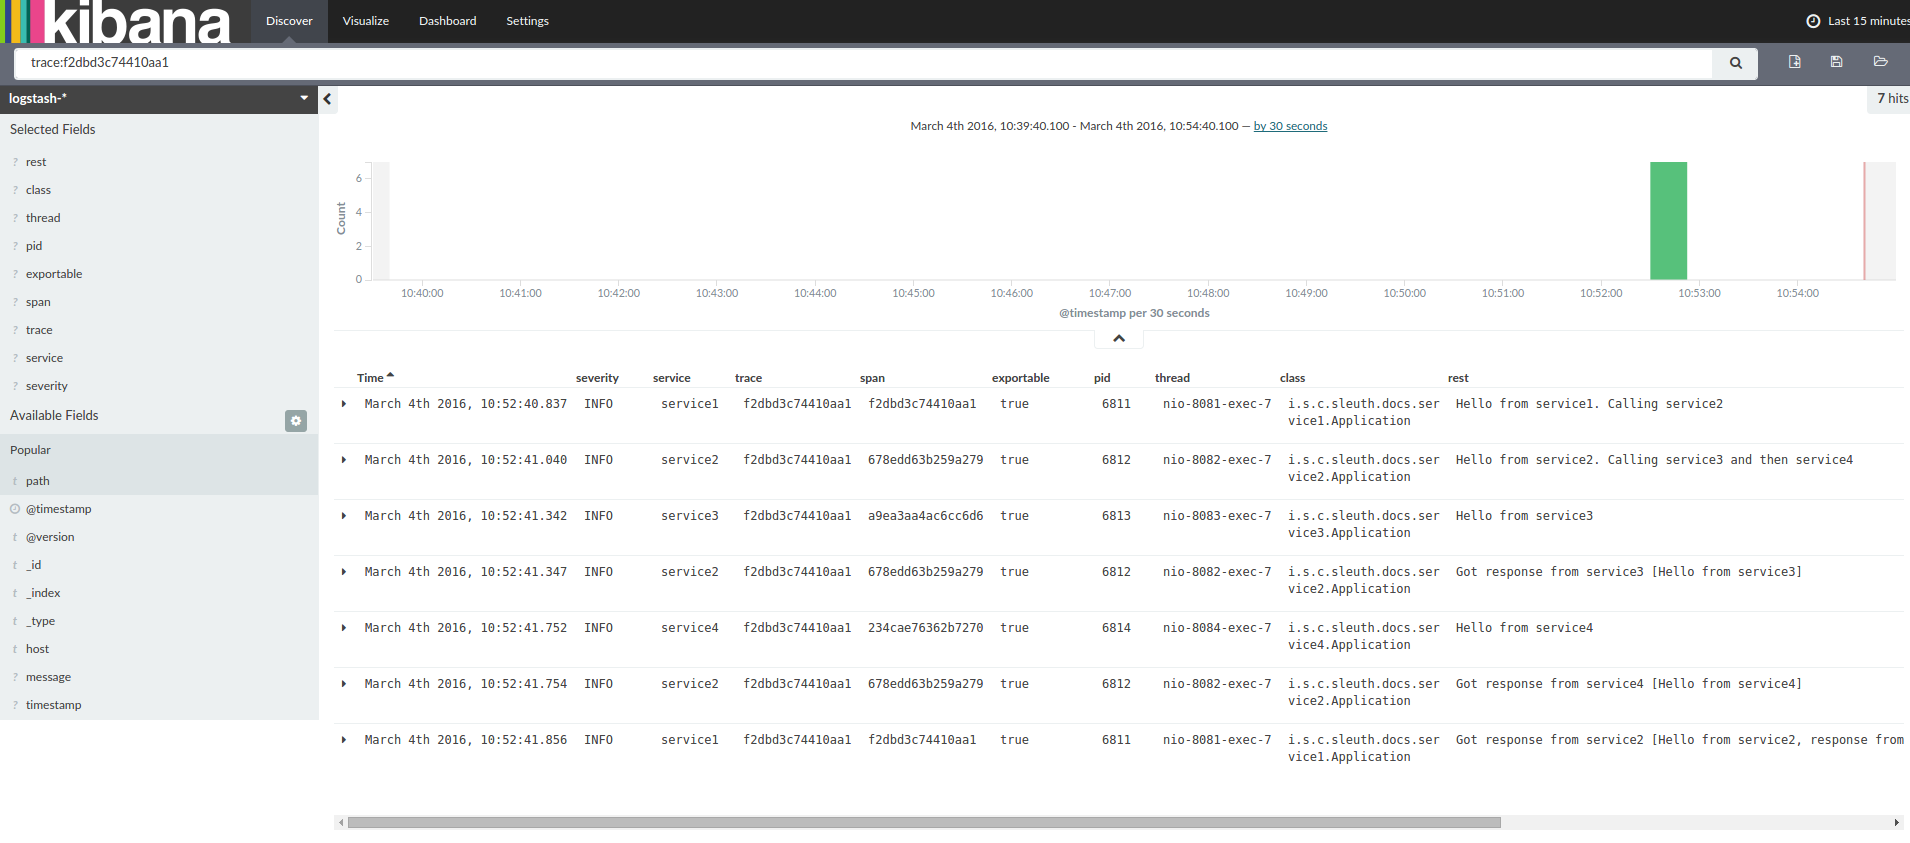
当使用trace id为2485ec27856c56f4抓取这四个应用的log时,会获得如下输出:
service1.log:2016-02-26 11:15:47.561 INFO [service1,2485ec27856c56f4,2485ec27856c56f4,true] 68058 --- [nio-8081-exec-1] i.s.c.sleuth.docs.service1.Application : Hello from service1. Calling service2
service2.log:2016-02-26 11:15:47.710 INFO [service2,2485ec27856c56f4,9aa10ee6fbde75fa,true] 68059 --- [nio-8082-exec-1] i.s.c.sleuth.docs.service2.Application : Hello from service2. Calling service3 and then service4
service3.log:2016-02-26 11:15:47.895 INFO [service3,2485ec27856c56f4,1210be13194bfe5,true] 68060 --- [nio-8083-exec-1] i.s.c.sleuth.docs.service3.Application : Hello from service3
service2.log:2016-02-26 11:15:47.924 INFO [service2,2485ec27856c56f4,9aa10ee6fbde75fa,true] 68059 --- [nio-8082-exec-1] i.s.c.sleuth.docs.service2.Application : Got response from service3 [Hello from service3]
service4.log:2016-02-26 11:15:48.134 INFO [service4,2485ec27856c56f4,1b1845262ffba49d,true] 68061 --- [nio-8084-exec-1] i.s.c.sleuth.docs.service4.Application : Hello from service4
service2.log:2016-02-26 11:15:48.156 INFO [service2,2485ec27856c56f4,9aa10ee6fbde75fa,true] 68059 --- [nio-8082-exec-1] i.s.c.sleuth.docs.service2.Application : Got response from service4 [Hello from service4]
service1.log:2016-02-26 11:15:48.182 INFO [service1,2485ec27856c56f4,2485ec27856c56f4,true] 68058 --- [nio-8081-exec-1] i.s.c.sleuth.docs.service1.Application : Got response from service2 [Hello from service2, response from service3 [Hello from service3] and from service4 [Hello from service4]]
如果你使用log集合工具例如Kibana、Splunk等,你可以看到事件的发生信息,Kibana的例子如下:
以下是Logstash的Grok模式:
filter {
# pattern matching logback pattern
grok {
match => { "message" => "%{TIMESTAMP_ISO8601:timestamp}\s+%{LOGLEVEL:severity}\s+\[%{DATA:service},%{DATA:trace},%{DATA:span},%{DATA:exportable}\]\s+%{DATA:pid}---\s+\[%{DATA:thread}\]\s+%{DATA:class}\s+:\s+%{GREEDYDATA:rest}" }
}
}
JSON Logback with Logstash
为了方便获取Logstash,通常保存log在JSON文件中而不是text文件中,配置方法如下:
依赖建立
- 确保Logback在classpath中(ch.qos.logback:logback-core)
- 增加LogstashLogback编码 - version 4.6的例子:net.logstash.logback:logstash-logback-encoder:4.6
Logback建立
以下是一个Logback配置的例子:
- 使用JSON格式记录应用信息到build/${spring.application.name}.json文件
- 有两个添加注释源- console和标准log文件
- 与之前章节使用相同的log模式
<?xml version="1.0" encoding="UTF-8"?>
<configuration>
<include resource="org/springframework/boot/logging/logback/defaults.xml"/>
<springProperty scope="context" name="springAppName" source="spring.application.name"/>
<!-- Example for logging into the build folder of your project -->
<property name="LOG_FILE" value="${BUILD_FOLDER:-build}/${springAppName}"/>
<property name="CONSOLE_LOG_PATTERN"
value="%clr(%d{yyyy-MM-dd HH:mm:ss.SSS}){faint} %clr(${LOG_LEVEL_PATTERN:-%5p}) %clr([${springAppName:-},%X{X-B3-TraceId:-},%X{X-B3-SpanId:-},%X{X-Span-Export:-}]){yellow} %clr(${PID:- }){magenta} %clr(---){faint} %clr([%15.15t]){faint} %clr(%-40.40logger{39}){cyan} %clr(:){faint} %m%n${LOG_EXCEPTION_CONVERSION_WORD:-%wEx}"/>
<!-- Appender to log to console -->
<appender name="console" class="ch.qos.logback.core.ConsoleAppender">
<filter class="ch.qos.logback.classic.filter.ThresholdFilter">
<!-- Minimum logging level to be presented in the console logs-->
<level>INFO</level>
</filter>
<encoder>
<pattern>${CONSOLE_LOG_PATTERN}</pattern>
<charset>utf8</charset>
</encoder>
</appender>
<!-- Appender to log to file -->
<appender name="flatfile" class="ch.qos.logback.core.rolling.RollingFileAppender">
<file>${LOG_FILE}</file>
<rollingPolicy class="ch.qos.logback.core.rolling.TimeBasedRollingPolicy">
<fileNamePattern>${LOG_FILE}.%d{yyyy-MM-dd}.gz</fileNamePattern>
<maxHistory>7</maxHistory>
</rollingPolicy>
<encoder>
<pattern>${CONSOLE_LOG_PATTERN}</pattern>
<charset>utf8</charset>
</encoder>
</appender>
<!-- Appender to log to file in a JSON format -->
<appender name="logstash" class="ch.qos.logback.core.rolling.RollingFileAppender">
<file>${LOG_FILE}.json</file>
<rollingPolicy class="ch.qos.logback.core.rolling.TimeBasedRollingPolicy">
<fileNamePattern>${LOG_FILE}.json.%d{yyyy-MM-dd}.gz</fileNamePattern>
<maxHistory>7</maxHistory>
</rollingPolicy>
<encoder class="net.logstash.logback.encoder.LoggingEventCompositeJsonEncoder">
<providers>
<timestamp>
<timeZone>UTC</timeZone>
</timestamp>
<pattern>
<pattern>
{
"severity": "%level",
"service": "${springAppName:-}",
"trace": "%X{X-B3-TraceId:-}",
"span": "%X{X-B3-SpanId:-}",
"exportable": "%X{X-Span-Export:-}",
"pid": "${PID:-}",
"thread": "%thread",
"class": "%logger{40}",
"rest": "%message"
}
</pattern>
</pattern>
</providers>
</encoder>
</appender>
<root level="INFO">
<!--<appender-ref ref="console"/>-->
<appender-ref ref="logstash"/>
<!--<appender-ref ref="flatfile"/>-->
</root>
</configuration>
添加进工程
仅Sleuth(log收集)
如果仅需要Spring Cloud Sleuth而不需要Zipkin集成,只需要增加spring-cloud-starter-sleuth模块到你工程中
- 为了不手动添加版本号,更好的方式是通过Spring BOM添加dependencymanagement
- 添加依赖到spring-cloud-starter-sleuth
<dependencyManagement> (1)
<dependencies>
<dependency>
<groupId>org.springframework.cloud</groupId>
<artifactId>spring-cloud-dependencies</artifactId>
<version>Brixton.RELEASE</version>
<type>pom</type>
<scope>import</scope>
</dependency>
</dependencies>
</dependencyManagement>
<dependency> (2)
<groupId>org.springframework.cloud</groupId>
<artifactId>spring-cloud-starter-sleuth</artifactId>
</dependency>
- 为了不手动添加版本号,更好的方式是通过Spring BOM添加dependencymanagement
- 添加依赖到spring-cloud-starter-sleuth
dependencyManagement { (1)
imports {
mavenBom "org.springframework.cloud:spring-cloud-dependencies:Brixton.RELEASE"
}
}
dependencies { (2)
compile "org.springframework.cloud:spring-cloud-starter-sleuth"
}
通过HTTP使用基于Zipkin的Sleuth
如果你需要Sleuth和Zipkin,只需要添加spring-cloud-starter-zipkin依赖
- 为了不手动添加版本号,更好的方式是通过Spring BOM添加dependencymanagement
- 添加依赖到spring-cloud-starter-zipkin
<dependencyManagement> (1)
<dependencies>
<dependency>
<groupId>org.springframework.cloud</groupId>
<artifactId>spring-cloud-dependencies</artifactId>
<version>Brixton.RELEASE</version>
<type>pom</type>
<scope>import</scope>
</dependency>
</dependencies>
</dependencyManagement>
<dependency> (2)
<groupId>org.springframework.cloud</groupId>
<artifactId>spring-cloud-starter-zipkin</artifactId>
</dependency>
- 为了不手动添加版本号,更好的方式是通过Spring BOM添加dependencymanagement
- 添加依赖到spring-cloud-starter-zipkin
dependencyManagement { (1)
imports {
mavenBom "org.springframework.cloud:spring-cloud-dependencies:Brixton.RELEASE"
}
}
dependencies { (2)
compile "org.springframework.cloud:spring-cloud-starter-zipkin"
}
通过Spring Cloud Stream使用Sleuth+Zipkin
- 为了不手动添加版本号,更好的方式是通过Spring BOM添加dependencymanagement
- 添加依赖到spring-cloud-sleuth-stream
- 添加依赖到spring-cloud-starter-sleuth
- 添加一个binder(e.g.Rabbit binder)来告诉Spring Cloud Stream应该绑定什么
<dependencyManagement> (1)
<dependencies>
<dependency>
<groupId>org.springframework.cloud</groupId>
<artifactId>spring-cloud-dependencies</artifactId>
<version>Brixton.RELEASE</version>
<type>pom</type>
<scope>import</scope>
</dependency>
</dependencies>
</dependencyManagement>
<dependency> (2)
<groupId>org.springframework.cloud</groupId>
<artifactId>spring-cloud-sleuth-stream</artifactId>
</dependency>
<dependency> (3)
<groupId>org.springframework.cloud</groupId>
<artifactId>spring-cloud-starter-sleuth</artifactId>
</dependency>
<!-- EXAMPLE FOR RABBIT BINDING -->
<dependency> (4)
<groupId>org.springframework.cloud</groupId>
<artifactId>spring-cloud-stream-binder-rabbit</artifactId>
</dependency>
- 为了不手动添加版本号,更好的方式是通过Spring BOM添加dependencymanagement
- 添加依赖到spring-cloud-sleuth-stream
- 添加依赖到spring-cloud-starter-sleuth
- 添加一个binder(e.g.Rabbit binder)来告诉Spring Cloud Stream应该绑定什么
dependencyManagement { (1)
imports {
mavenBom "org.springframework.cloud:spring-cloud-dependencies:Brixton.RELEASE"
}
}
dependencies {
compile "org.springframework.cloud:spring-cloud-sleuth-stream" (2)
compile "org.springframework.cloud:spring-cloud-starter-sleuth" (3)
// Example for Rabbit binding
compile "org.springframework.cloud:spring-cloud-stream-binder-rabbit" (4)
}
Spring Cloud Sleuth Stream Zipkin Collector
启动一个Spring Cloud Sleuth Stream Zipkin收集器只需要添加spring-cloud-sleuth-zipkin-stream依赖
- 为了不手动添加版本号,更好的方式是通过Spring BOM添加dependencymanagement
- 添加依赖到spring-cloud-sleuth-zipkin-stream
- 添加依赖到spring-cloud-starter-sleuth
- 添加一个binder(e.g.Rabbit binder)来告诉Spring Cloud Stream应该绑定什么
<dependencyManagement> (1)
<dependencies>
<dependency>
<groupId>org.springframework.cloud</groupId>
<artifactId>spring-cloud-dependencies</artifactId>
<version>Brixton.RELEASE</version>
<type>pom</type>
<scope>import</scope>
</dependency>
</dependencies>
</dependencyManagement>
<dependency> (2)
<groupId>org.springframework.cloud</groupId>
<artifactId>spring-cloud-sleuth-zipkin-stream</artifactId>
</dependency>
<dependency> (3)
<groupId>org.springframework.cloud</groupId>
<artifactId>spring-cloud-starter-sleuth</artifactId>
</dependency>
<!-- EXAMPLE FOR RABBIT BINDING -->
<dependency> (4)
<groupId>org.springframework.cloud</groupId>
<artifactId>spring-cloud-stream-binder-rabbit</artifactId>
</dependency>
- 为了不手动添加版本号,更好的方式是通过Spring BOM添加dependencymanagement
- 添加依赖到spring-cloud-sleuth-zipkin-stream
- 添加依赖到spring-cloud-starter-sleuth
- 添加一个binder(e.g.Rabbit binder)来告诉Spring Cloud Stream应该绑定什么
dependencyManagement { (1)
imports {
mavenBom "org.springframework.cloud:spring-cloud-dependencies:Brixton.RELEASE"
}
}
dependencies {
compile "org.springframework.cloud:spring-cloud-sleuth-zipkin-stream" (2)
compile "org.springframework.cloud:spring-cloud-starter-sleuth" (3)
// Example for Rabbit binding
compile "org.springframework.cloud:spring-cloud-stream-binder-rabbit" (4)
}
之后只需要在你的主类中添加@EnableZipkinStreamServer注解
package example;
import org.springframework.boot.SpringApplication;
import org.springframework.boot.autoconfigure.SpringBootApplication;
import org.springframework.cloud.sleuth.zipkin.stream.EnableZipkinStreamServer;
@SpringBootApplication
@EnableZipkinStreamServer
public class ZipkinStreamServerApplication {
public static void main(String[] args) throws Exception {
SpringApplication.run(ZipkinStreamServerApplication.class, args);
}
}
特点(Features)
添加trace和spanid到Slf4J MDC,然后就可以从一个给定的trace或span中提取所有的log,例如
2016-02-02 15:30:57.902 INFO [bar,6bfd228dc00d216b,6bfd228dc00d216b,false] 23030 --- [nio-8081-exec-3] ...
2016-02-02 15:30:58.372 ERROR [bar,6bfd228dc00d216b,6bfd228dc00d216b,false] 23030 --- [nio-8081-exec-3] ...
2016-02-02 15:31:01.936 INFO [bar,46ab0d418373cbc9,46ab0d418373cbc9,false] 23030 --- [nio-8081-exec-4] ...
注意MDC中的[appname,traceId,spanId,exportable]:
- spanId - the id of a specific operation that took place
- appname - the name of the application that logged the span
- traceId - the id of the latency graph that contains the span
- exportable - whether the log should be exported to Zipkin or not. Whenwould you like the span not to be exportable? In the case in which you want towrap some operation in a Span and have it written to the logs only.
在通常的分布式追踪数据模型上提供一种抽象模型:traces、spans(生成一个DAG)、annotations、key-value annotations。基于HTrace是较为宽松的,但Zipkin(Dapper)更具兼容性
Sleuth记录时间信息来帮助延迟分析,使用Sleuth可以精确找到应用中延迟的原因,Sleuth不会log太多,因此不会导致你的应用挂掉
- propagatesstructural data about your call-graph in-band, and the rest out-of-band
- includesopinionated instrumentation of layers such as HTTP
- includessampling policy to manage volume
- canreport to a Zipkin system for query and visualization
使用Spring应用装备出入口点(servletfilter、async endpoints、rest template、scheduled actions、messagechannels、zuul filters、feign client)
Sleuth包含默认逻辑通过http或messaging boundaries来加入一个trace,例如,http传播通过Zipkin-compatiblerequest headers工作,这个传播逻辑定义和定制是通过SpanInjector和SpanExtractor实现提供简单的接受或放弃span
度量(metrics)
如果依赖了spring-cloud-sleuth-zipkin,应用将生成并收集Zipkin-compatible traces,一般会通过HTTP将这些traces发送给一个本地Zipkin服务器(port 9411),使用spring.zipkin.baseUrl来配置服务的地址
如果依赖了spring-cloud-sleuth-stream,应用将通过Spring Cloud Stream生成并收集traces,应用自动成为tracer消息的生产者,这些消息会通过你的中间件分发(e.g. RabbitMQ,Apache Kafka,Redis)
如果使用Zipkin或Stream,使用spring.sleuth.sampler.percentage配置输出spans的百分比(默认10%),不然你可能会认为Sleuth没有工作,因为他省略了一些spans
SLF4J MDC一直处于工作状态,logback用户可以在logs中立刻看到trace和span id,其他logging系统不得不配置他们自己的模式以得到相同的结果,默认logging.pattern.level设置为%clr(%5p) %clr([${spring.application.name:},%X{X-B3-TraceId:-},%X{X-B3-SpanId:-},%X{X-Span-Export:-}]){yellow}(对于logback用户,这是一种Spring Boot特征),这意味着如果你没有使用SLF4J这个模式将不会自动适用
抽样(Samling)
在分布式追踪时,数据量可能会非常大,因此抽样就变得非常重要(通常不需要导出所有的spans以得到事件发生原貌),Spring Cloud Sleuth有一个Sampler战略,即用户可以控制抽样算法,Samplers不会停止正在生成的span id(相关的),但他们会阻止tags和events附加和输出,默认战略是当一个span处于活跃状态会继续trace,但新的span会一直处于不输出状态,如果所有应用都使用这个sampler,你会在logs中看到traces,但不会出现在任何远程仓库。测试状态资源都是充足的,并且你只使用logs的话他就是你需要的全部(e.g.一个ELK集合),如果输出span数据到Zipkin或Spring Cloud Stream,有AlwaysSampler输出所有数据和PercentageBasedSampler采样spans确定的一部分。
如果使用spring-cloud-sleuth-zipkin或spring-cloud-sleuth-stream,PercentageBasedSampler是默认的,你可以使用spring.sleuth.sampler.percentage配置输出
通过创建一个bean定义就可以新建一个sampler
@Bean
public Sampler defaultSampler() {
return new AlwaysSampler();
}
Instrumentation
Spring Cloud Sleuth自动装配所有Spring应用,因此你不用做任何事来让他工作,装配是使用一系列技术添加的,例如对于一个servlet web应用我们使用一个Filter,对于SpringIntegration我们使用ChannelInterceptors。
用户可以使用span tags定制关键字,为了限制span数据量,一般一个HTTP请求只会被少数元数据标记,例如status code、host以及URL,用户可以通过配置spring.sleuth.keys.http.headers(一系列头名称)添加request headers。
tags仅在Sampler允许其被收集和输出时工作(默认情况其不工作,因此不会有在不配置的情况下收集过多数据的意外危险出现)
Span生命周期
通过Trace接口的方式可以在Span上进行如下操作:
- start -当打开一个span时,其名字被指定且开始时间戳被记录
- close - span已经结束(span的结束时间已被记录)并且如果span是输出的,他将是Zipkin合适的收集项,span在当前线程也将被移除
- continue - span的一个新实例将被创建,然而他将是正是正在运行的span的一个复制体
- detach - span不会停止或关闭,他只会被从当前线程中移除
- create with explicit parent -建立一个新的span并设置一个明确的parent给他
新建和关闭spans
使用Tracer接口可以手动新建spans
// Start a span. If there was a span present in this thread it will become
// the `newSpan`'s parent.
Span newSpan = this.tracer.createSpan("calculateTax");
try {
// ...
// You can tag a span
this.tracer.addTag("taxValue", taxValue);
// ...
// You can log an event on a span
newSpan.logEvent("taxCalculated");
} finally {
// Once done remember to close the span. This will allow collecting
// the span to send it to Zipkin
this.tracer.close(newSpan);
}
在例子中我们可以看到如何新建一个span实例,假设在当前线程中已经有一个span,那么新建的线程将会是这个线程的parent。
新建span后要记得清除他!如果你想要将一个span发送给Zipkin,不要忘记关闭他。
持续(Continuing)spans
有时你不想要新建一个span但你又想持续使用,这种情况的例子可能如下(当然实际依赖于使用情况):
- AOP -如果在实际应用前已经有一个span新建可用,那么就不需要新建一个span
- Hystrix -对于当前处理流程而言,执行Hystrix操作是最为合理的一部分,实际上只有技术实现细节的话,不必将他作为分离的部分反映在tracing中
span的持续实例等同于正在运行的:
Span continuedSpan = this.tracer.continueSpan(spanToContinue);
assertThat(continuedSpan).isEqualTo(spanToContinue);
可以使用Tracer接口延续一个span
// let's assume that we're in a thread Y and we've received
// the `initialSpan` from thread X
Span continuedSpan = this.tracer.continueSpan(initialSpan);
try {
// ...
// You can tag a span
this.tracer.addTag("taxValue", taxValue);
// ...
// You can log an event on a span
continuedSpan.logEvent("taxCalculated");
} finally {
// Once done remember to detach the span. That way you'll
// safely remove it from the current thread without closing it
this.tracer.detach(continuedSpan);
}
新建一个span后记得清除他!如果有些工作在一个线程(e.g. thread X)中已经结束并且他在等待另外的线程(e.g. Y,Z)结束时,不要忘记分离span,在线程Y,Z中的spans在他们工作结束时也应被分离,结果收集完成时thread X中的span应该被关闭
使用明确的parent新建spans
如果你想新建一个span并且提供一个明确的parent给他,假设span的parent在一个thread中,而你想在另一个thread中新建span,Tracer接口的startSpan命令就是你需要的。
// let's assume that we're in a thread Y and we've received
// the `initialSpan` from thread X. `initialSpan` will be the parent
// of the `newSpan`
Span newSpan = this.tracer.createSpan("calculateCommission", initialSpan);
try {
// ...
// You can tag a span
this.tracer.addTag("commissionValue", commissionValue);
// ...
// You can log an event on a span
newSpan.logEvent("commissionCalculated");
} finally {
// Once done remember to close the span. This will allow collecting
// the span to send it to Zipkin. The tags and events set on the
// newSpan will not be present on the parent
this.tracer.close(newSpan);
}
记得在新建这样的span后关闭他,否则你在你的log中看到大量的相关warning,更糟糕的是你的span不会正常关闭,这样的话就无法被Zipkin收集
命名spans
为span命名是很重要的工作,span名称必须描述了一个操作名称,名称必须要简明(e.g.不包括标识符)。
Since there is a lot of instrumentation going on some of thespan names will be artificial like:
· controller-method-name when received by a Controller with a methodnameconrollerMethodName
· async for asynchronous operations done via wrappedCallable andRunnable
· @Scheduled annotated methods will return the simple nameof the class
Fortunately, for the asynchronous processing you can provideexplicit naming.
@SpanName注解
可以使用@SpanName注解明确命名span
@SpanName("calculateTax")
class TaxCountingRunnable implements Runnable {
@Override public void run() {
// perform logic
}
}
在这种情况下,使用下面的方式便命名一个span为calculateTax
Runnable runnable = new TraceRunnable(tracer, spanNamer, new TaxCountingRunnable());
Future<?> future = executorService.submit(runnable);
// ... some additional logic ...
future.get();
toString()方法
为Runnable或Callable建立分离的classes是非常少见的,一般建立这些classes的匿名实例,你不能注解这些classes除非override,如果没有@SpanName注解,我们将会检查class是否使用传统的toString()方法实现
执行这些代码将新建一个名为calculateTax的span:
Runnable runnable = new TraceRunnable(tracer, spanNamer, new Runnable() {
@Override public void run() {
// perform logic
}
@Override public String toString() {
return "calculateTax";
}
});
Future<?> future = executorService.submit(runnable);
// ... some additional logic ...
future.get();
定制化
使用SpanInjector和SpanExtractor你可以定制化span的新建和传播。
当前有两种built-in方法来在进程间传递tracing信息:
- 通过SpringIntegration
- 通过HTTP
span id是从Zipkin-compatible(B3)头中提取的(不论Message或HTTP头),以此来开始或加入一个存在的trace,trace信息被注入到输出请求中,这样后面的步骤就可以提取他。
Spring Integration
对于Spring Integration,存在beans负责span从Message的创建和使用tracing信息装配MessageBuilder。
@Bean
public SpanExtractor<Message> messagingSpanExtractor() {
...
}
@Bean
public SpanInjector<MessageBuilder> messagingSpanInjector() {
...
}
用户可以使用自己的实现来override他,或者添加@Primary注解到你的bean定义
HTTP
对于HTTP,存在beans负责span从HttpServletRequest的创建和使用tracing信息装配HttpServletResponse。
@Bean
public SpanExtractor<HttpServletRequest> httpServletRequestSpanExtractor() {
...
}
@Bean
public SpanInjector<HttpServletResponse> httpServletResponseSpanInjector() {
...
}
用户可以使用自己的实现来override他,或者添加@Primary注解到你的bean定义
例子
对比传统的兼容Zipkin,tracingHTTP头名有以下格式
- traceid - correlationId
- spanid - mySpanId
以下是一个SpanExtractor的例子
static class CustomHttpServletRequestSpanExtractor
implements SpanExtractor<HttpServletRequest> {
@Override
public Span joinTrace(HttpServletRequest carrier) {
long traceId = Span.hexToId(carrier.getHeader("correlationId"));
long spanId = Span.hexToId(carrier.getHeader("mySpanId"));
// extract all necessary headers
Span.SpanBuilder builder = Span.builder().traceId(traceId).spanId(spanId);
// build rest of the Span
return builder.build();
}
}
以下SpanInjector将被建立
static class CustomHttpServletResponseSpanInjector
implements SpanInjector<HttpServletResponse> {
@Override
public void inject(Span span, HttpServletResponse carrier) {
carrier.addHeader("correlationId", Span.idToHex(span.getTraceId()));
carrier.addHeader("mySpanId", Span.idToHex(span.getSpanId()));
// inject the rest of Span values to the header
}
}
并且你可以这样注册他们
@Bean
@Primary
SpanExtractor<HttpServletRequest> customHttpServletRequestSpanExtractor() {
return new CustomHttpServletRequestSpanExtractor();
}
@Bean
@Primary
SpanInjector<HttpServletResponse> customHttpServletResponseSpanInjector() {
return new CustomHttpServletResponseSpanInjector();
}
SpringData as Messages
可以通过Spring Cloud Stream来积累和发送span数据,配置时需要包含spring-cloud-sleuth-streamjar为依赖且增加一个Channel Binder实现方式(e.g. spring-cloud-starter-stream-rabbit对应RabbitMQ或spring-cloud-starter-stream-kafka对应Kafka),使用payload格式Spans将自动把你的app变为一个信息生产者
Zipkin Consumer
有一种特殊而又便利的注解方式,即为span数据建立一个信息消费者,并将他推到一个Zipkin SpanStrore中
@SpringBootApplication
@EnableZipkinStreamServer
public class Consumer {
public static void main(String[] args) {
SpringApplication.run(Consumer.class, args);
}
}
这种应用将通过Spring Cloud Stream Binder监听不论何种方式传输的span数据(e.g.包括spring-cloud-starter-stream-rabbit对应RabbitMQ,和对应Redis和Kafka的类似starter存在),如果添加以下UI依赖
<groupId>io.zipkin.java</groupId>
<artifactId>zipkin-autoconfigure-ui</artifactId>
你将启动一个Zipkin server应用,他将通过端口9411访问UI和api。
默认SpanStore是in-memory的(适合于demos且启动迅速),你可以添加MySQL和spring-boot-starter-jdbc到你的系统环境并通过配置激活JDBC SpanStore。例如:
spring:
rabbitmq:
host: ${RABBIT_HOST:localhost}
datasource:
schema: classpath:/mysql.sql
url: jdbc:mysql://${MYSQL_HOST:localhost}/test
username: root
password: root
# Switch this on to create the schema on startup:
initialize: true
continueOnError: true
sleuth:
enabled: false
zipkin:
storage:
type: mysql
@EnableZipkinStreamServer也使用@EnableZipkinServer注解,因此进程也会显示标准Zipkin服务终端以通过HTTP收集span,且可以通过Zipkin Web UI查询
定制消费者
使用spring-cloud-sleuth-stream且绑定SleuthSink可以很方便的实现定制消费者。例子:
@EnableBinding(SleuthSink.class)
@SpringBootApplication(exclude = SleuthStreamAutoConfiguration.class)
@MessageEndpoint
public class Consumer {
@ServiceActivator(inputChannel = SleuthSink.INPUT)
public void sink(Spans input) throws Exception {
// ... process spans
}
}
上述的消费者应用明确排除SleuthStreamAutoConfiguration,因此他不会给自己发消息,但这是可选的(你可能想要trace请求到消费者app)
度量(Metrics)
当前Spring Cloud Sleuth记录非常简单的spans metrics,使用Spring Boot的metrics support来计算接收丢弃的span数量,当有span发送给Zipkin时,接收span的数量就会增加,如果有错误发生,丢弃span数量就会增加。
Integrations
Runable和Callable
如果你要将你的逻辑包裹在Runable或Callable中,足够将这些classes放到他们的Sleuth代表中。
Runnable的例子:
Runnable runnable = new Runnable() {
@Override
public void run() {
// do some work
}
@Override
public String toString() {
return "spanNameFromToStringMethod";
}
};
// Manual `TraceRunnable` creation with explicit "calculateTax" Span name
Runnable traceRunnable = new TraceRunnable(tracer, spanNamer, runnable, "calculateTax");
// Wrapping `Runnable` with `Tracer`. The Span name will be taken either from the
// `@SpanName` annotation or from `toString` method
Runnable traceRunnableFromTracer = tracer.wrap(runnable);
Callable的例子:
Callable<String> callable = new Callable<String>() {
@Override
public String call() throws Exception {
return someLogic();
}
@Override
public String toString() {
return "spanNameFromToStringMethod";
}
};
// Manual `TraceCallable` creation with explicit "calculateTax" Span name
Callable<String> traceCallable = new TraceCallable<>(tracer, spanNamer, callable, "calculateTax");
// Wrapping `Callable` with `Tracer`. The Span name will be taken either from the
// `@SpanName` annotation or from `toString` method
Callable<String> traceCallableFromTracer = tracer.wrap(callable);
这种方式你可以保证一个新的Span在每次执行时新建和关闭。
Hystrix
传统并发策略
我们以将所有的Callable实例置入到他们的Sleuth代表-TraceCallable的方式来记录一个传统的HystrixConcurrencyStrategy,策略的打开或延续一个span取决于在Hystrix操作被调用前tracing是否在工作,为了使传统Hystrix并发策略无效可以设置spring.sleuth.hystrix.strategy.enable为false。
手动操作设置
假设你有以下HystrixCommand:
HystrixCommand<String> hystrixCommand = new HystrixCommand<String>(setter) {
@Override
protected String run() throws Exception {
return someLogic();
}
};
为了传递tracing信息你必须将同样的逻辑置于HystrixCommand的Sleuth版本中,也就是TraceCommand:
TraceCommand<String> traceCommand = new TraceCommand<String>(tracer, traceKeys, setter) {
@Override
public String doRun() throws Exception {
return someLogic();
}
};
RxJava
我们记录了一个典型的RxJavaSchedulersHook,他将所有Action0实例置入到他们的Sleuth代表-TraceAction中,hook打开或延续一个span取决于Action被安排前tracing是否已经在工作,为了使RxJavaSchedulersHook无效可设置spring.sleuth.rxjava.schedulers.hook.enabled为false。
You can define a list of regular expressions for thread names,for which you don’twant a Span to be created. Just provide a comma separated list of regularexpressions in the spring.sleuth.rxjava.schedulers.ignoredthreads property.
HTTP integration
将spring.sleuth.web.enabled配置值设置为false可以使这章中的特征方法无效
HTTP Filter
通过TraceFilter,所有抽样输入的请求都会归结到span的创建,span的名称为"http+请求发送的路径",例如,如果请求发送到/foo/bar,名称即为http:/foo/bar,你可以配置通过spring.sleuth.web.skipPattern,那些URIs将被过滤掉,如果你在环境中添加了ManagementServerProperties,你的contextPath值会附加到过滤配置上。
HandlerIntercepter
由于需要span名称的精确,我们使用一个TraceHandlerInterceptor来置入一个存在的HandlerInterceptor或直接添加到存在的HandlerInterceptors列表中,TraceHandlerInterceptor添加一个特殊的请求属性给HttpServletRequest,如果TraceFilter没有看到属性,他会建立一个"fallback"span,这是一个建立在服务端的附加的span,此时trace在UI中可以正确的显示。
HTTP client integration
同步RestTemplate
我们注入一个RestTemplate拦截器来保证所有的tracing信息被发送到请求端,每当一个请求被生成,一个新的span将被创建,他会在接收应答后关闭,为了限制同步RestTemplate只需要设置spring.sleuth.web.client.enabled为false。
你必须注册一个RestTemplate为bean以使得拦截器可以注入,如果你使用一个新的关键字建立一个RestTemplate实例,instrumentation将无法工作
异步RestTemplate
传统的instrumentation是通过发送接收请求来建立关闭span的,你可以通过注册你的bean来定制ClientHttpRequestFactory和AsyncClientHttpRequestFactory,记得使用tracing compatible实现方式(e.g.不要忘记将ThreadPoolTaskScheduler置入一个TraceAsyncListenableTaskExecutor),传统请求工厂例子如下:
Unresolved directive in spring-cloud-sleuth.adoc - include::../../../../spring-cloud-sleuth-core/src/test/java/org/springframework/cloud/sleuth/instrument/web/client/TraceWebAsyncClientAutoConfigurationTest.java[tags=async_template_factories,indent=0]
通过设置spring.sleuth.web.async.client.enabled为false可以限制AsyncRestTemplate,使默认的TraceAsyncClientHttpRequestFactoryWrapper无效可以设置spring.sleuth.web.async.client.factory.enabled为false,如果你不想创建AsyncRestClient,设置spring.sleuth.web.async.client.template.enabled为false。
Feign
默认Spring Cloud Sleuth通过TraceFeignClientAutoConfiguration提供feign的集成,你可以设置spring.sleuth.feign.enabled为false来使他无效,如果这样设置那么所有feign相关的装配都无法发生。
通过FeignBeanPostProcessor feign装配的部分结束,可以设置spring.sleuth.feign.processor.enabled为false来是他无效化,如果你这样设置,Spring Cloud Sleuth将不会装配任何你的传统feign组件,所有默认装配保持原有状态。
异步通信
@Async注解方法
在Spring Cloud Sleuth中,我们装配异步关联组件以使得tracing信息可以在threads间传递,你可以通过设置spring.sleuth.async.enabled值为false来使其无效化。
如果你使用@Async来注解你的方法,我们将自动建立一个新的span:
- span名称将是注解方法名
- span将被标注为方法类名和方法名
@Scheduled注解方法
在Spring Cloud Sleuth中,我们装配scheduled执行方法以使得tracing信息可以在threads间传递,你可以通过设置spring.sleuth.scheduled.enabled值为false来使其无效化。
如果你使用@Scheduled来注解你的方法,我们将自建立一个新的span:
- span名称将是注解方法名
- span将被标注为方法类名和方法名
如果在一些@Scheduled注解类中你想跳过span新建过程,可以设置spring.sleuth.scheduled.skipPattern为一个指定的表达式,这将匹配@Scheduled注解类的完整描述名称。
Executor, ExecutorServiceand ScheduledExecutorService
我们提供了LazyTraceExecutor,TraceableExecutorService和TraceableScheduledExecutorService。每当一个新的任务被提交、调用或scheduled时,这些实现会建立新的spans。
以下是当使用CompletableFuture时如何用TraceableExecutorService传递tracing信息:
CompletableFuture<Long> completableFuture = CompletableFuture.supplyAsync(() -> {
// perform some logic
return 1_000_000L;
}, new TraceableExecutorService(executorService,
// 'calculateTax' explicitly names the span - this param is optional
tracer, traceKeys, spanNamer, "calculateTax"));
消息传递
Spring Cloud Sleuth集成了Spring Integration。他会建立span来发布或订阅事件,设置spring.sleuth.integration.enabled为false可以使Spring Integration无效。
Spring Cloud Sleuth到1.0.4版本前都是使用消息传递时发送无效tracing头,这些头和在HTTP(包含 - )发送的名称时一样的,为了在1.0.4版本的向后兼容目的,我们开始发送所有有效和无效的头,请更新到1.0.4,因为在Spring Cloud Sleuth 1.1中我们将会移除对分离头的支持。
从1.0.4后可以明确设置spring.sleuth.integration.patterns模式来提供你想要包含的tracing信道名称,默认所有的信道已被包含在内。
Zuul
我们注册Zuul过滤器来传播tracing信息(请求头使用tracing数据填满),可以设置spring.sleuth.zuul.enabled为false来关闭Zuul服务。
Moreinformation
https://cloud.spring.io/spring-cloud-sleuth/#_example
- Spring Cloud Sleuth使用简介
- Spring Cloud Sleuth使用简介
- spring cloud 使用sleuth +zipkin 实例测试
- 使用Spring Cloud Sleuth跟踪微服务
- Spring Cloud Sleuth Zipkin 升级使用
- Spring Cloud Sleuth Zipkin 升级使用
- Spring Cloud Sleuth 教程
- Spring Cloud Sleuth
- Spring cloud sleuth
- 全链路spring cloud sleuth+zipkin
- Spring Cloud Sleuth进阶实战
- Spring Cloud Sleuth+Zipkin实践
- Spring Cloud Sleuth进阶实战
- Spring Cloud Sleuth进阶实战
- Spring Cloud Sleuth消息追踪测试
- Spring Cloud Sleuth消息追踪原理
- Spring Cloud Sleuth (1)-入门篇
- Spring Cloud Sleuth (2)-与ELK集成
- Android实现Filterable通过输入文本框实现联系人自动筛选
- Centos安装python3.5.x和ipython
- DA14580 --- 广播开始分析
- cmd命令行能运行java,不能运行javac
- 坚持#第34天~上了一天课
- Spring Cloud Sleuth使用简介
- android.content.ActivityNotFoundException: No Activity found to handle Intent
- Windows系统下python与NumPy安装方法
- 英语学习——手如柔荑
- Andriod常用Menu之一:ContextMenu
- javascript helloworld 及数组
- >Hibernate 报错:this&nb…
- java的简单ftp上传文件案例
- hibernatesessionfactory