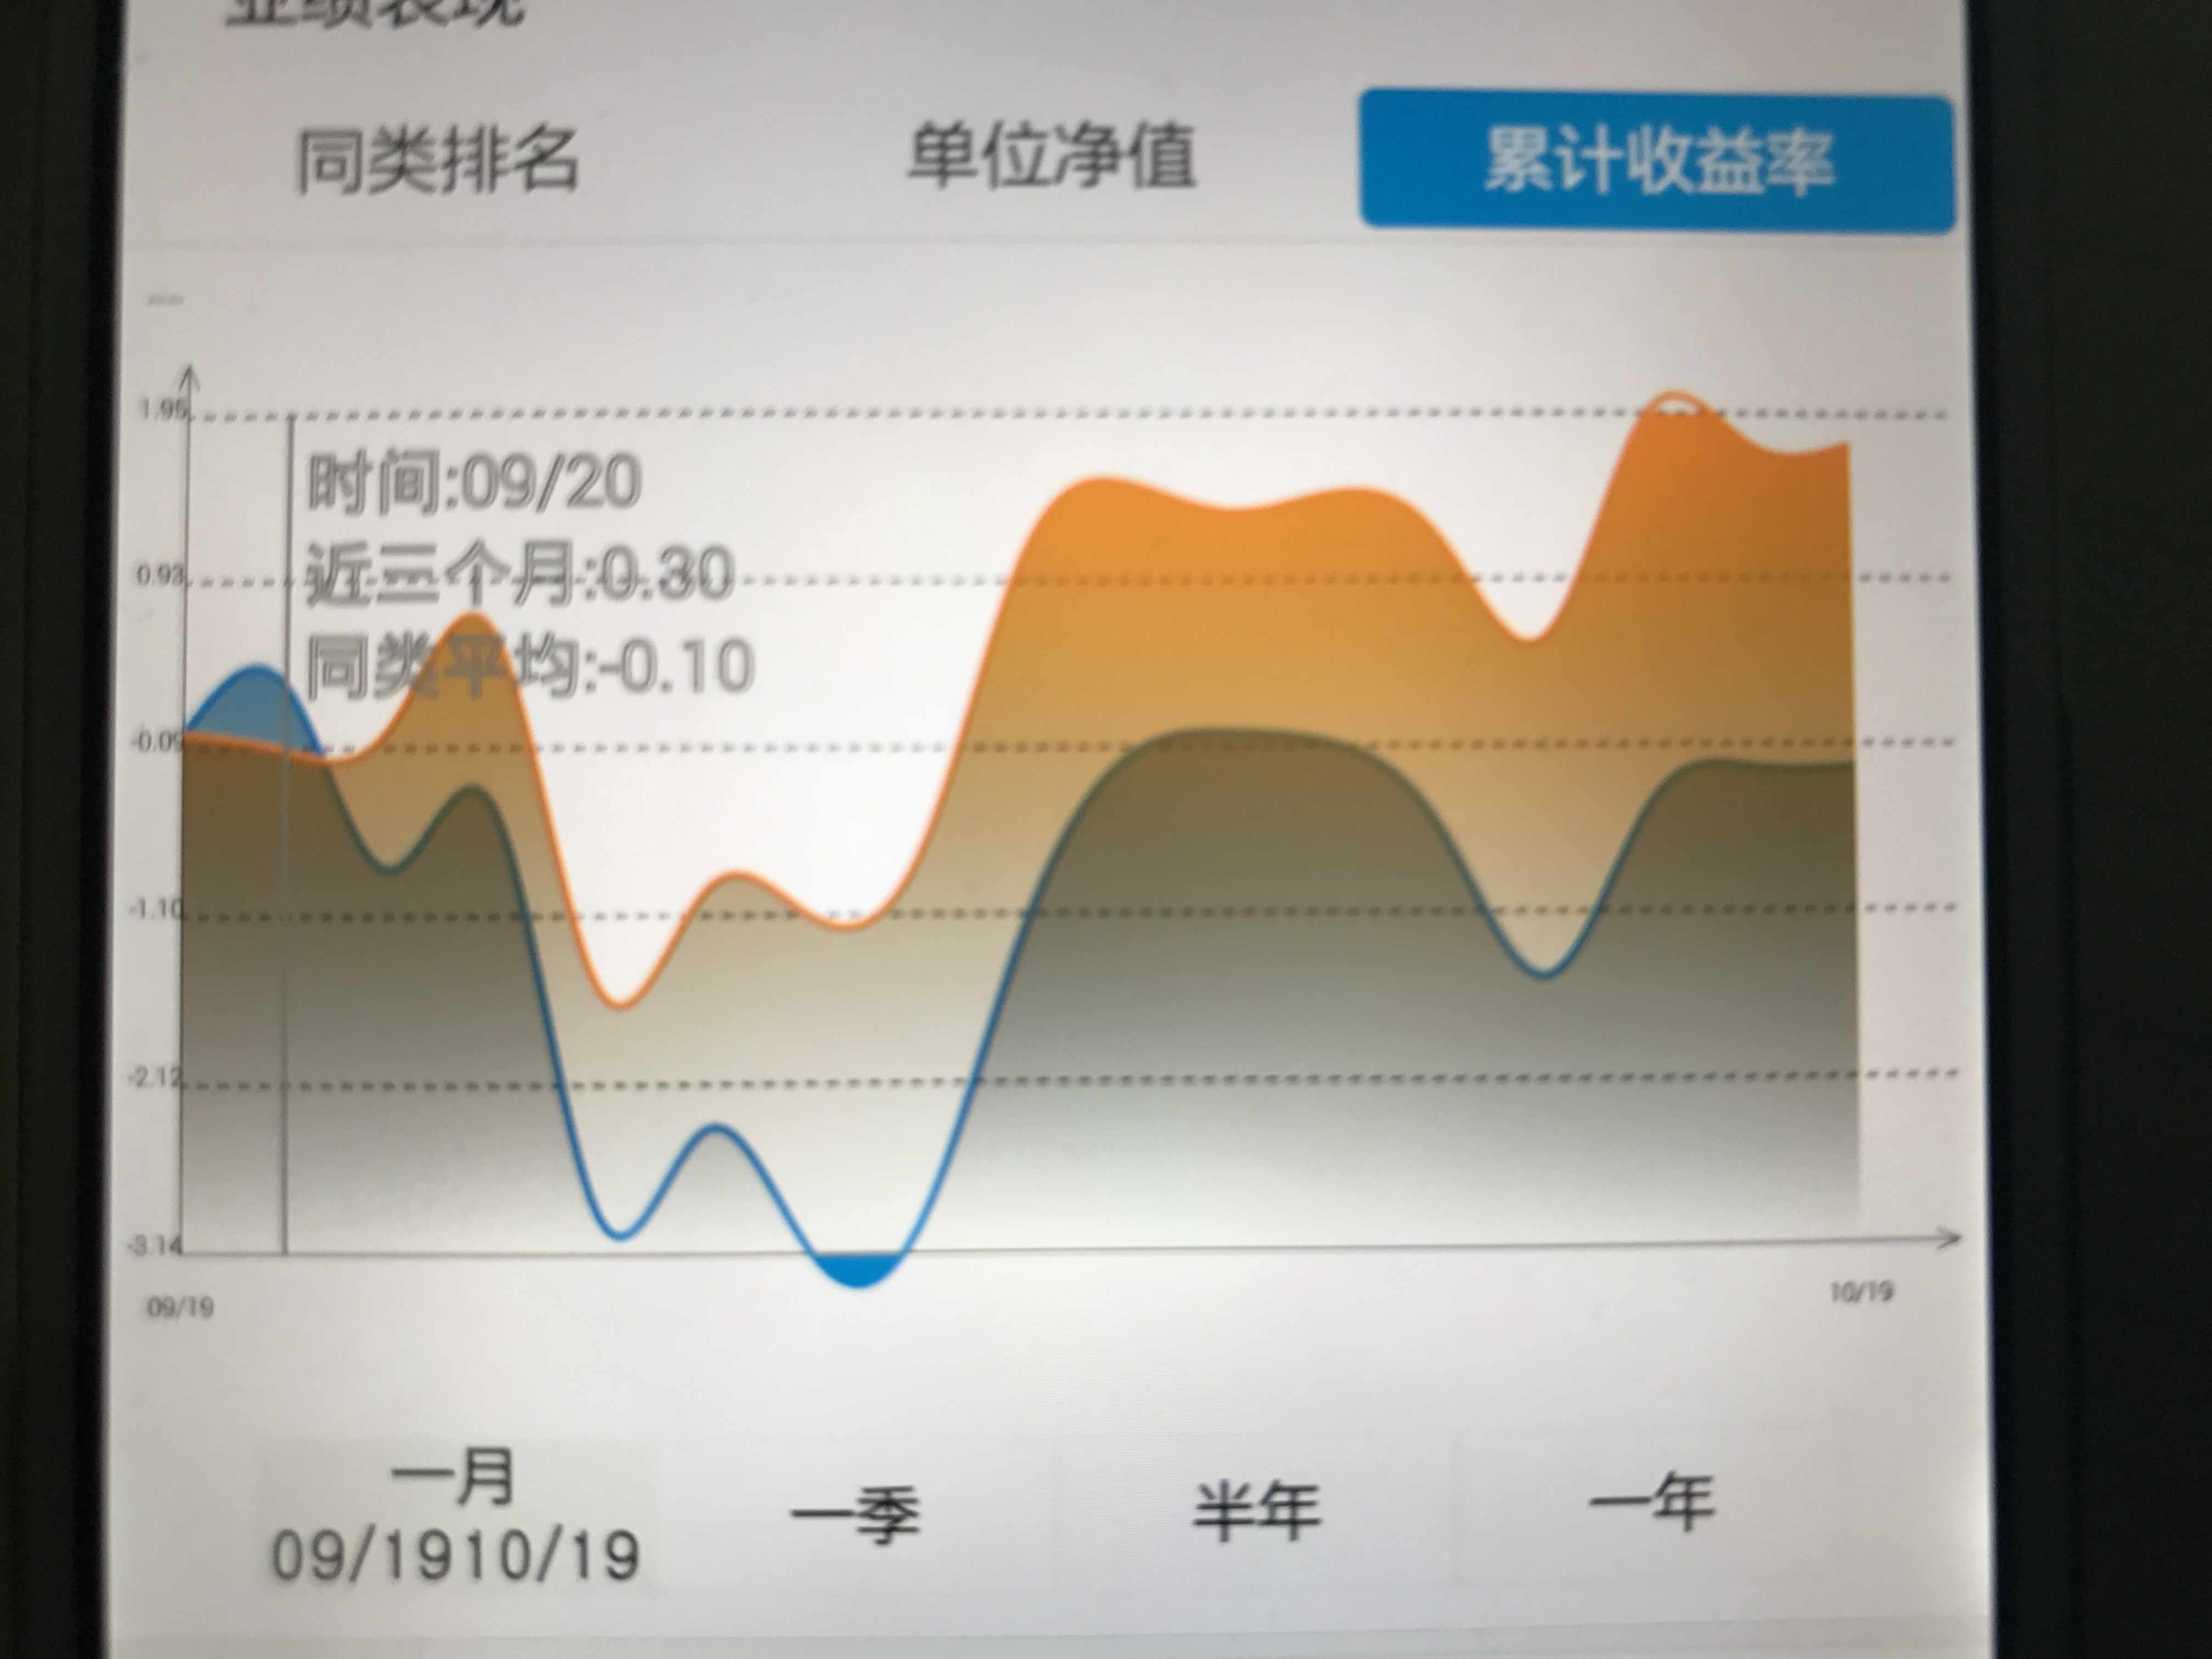
Android 开发:绘制多条线,带缓存,带触控的图表(基金图表的实现)
来源:互联网 发布:python post 请求截取 编辑:程序博客网 时间:2024/06/05 22:39
对之前的几篇文章里的model进行补充
后期会把这个功能类,添加到这个框架里 链接 Android开发框架,有兴趣的可以下载下来看,这个框架会经常更新: 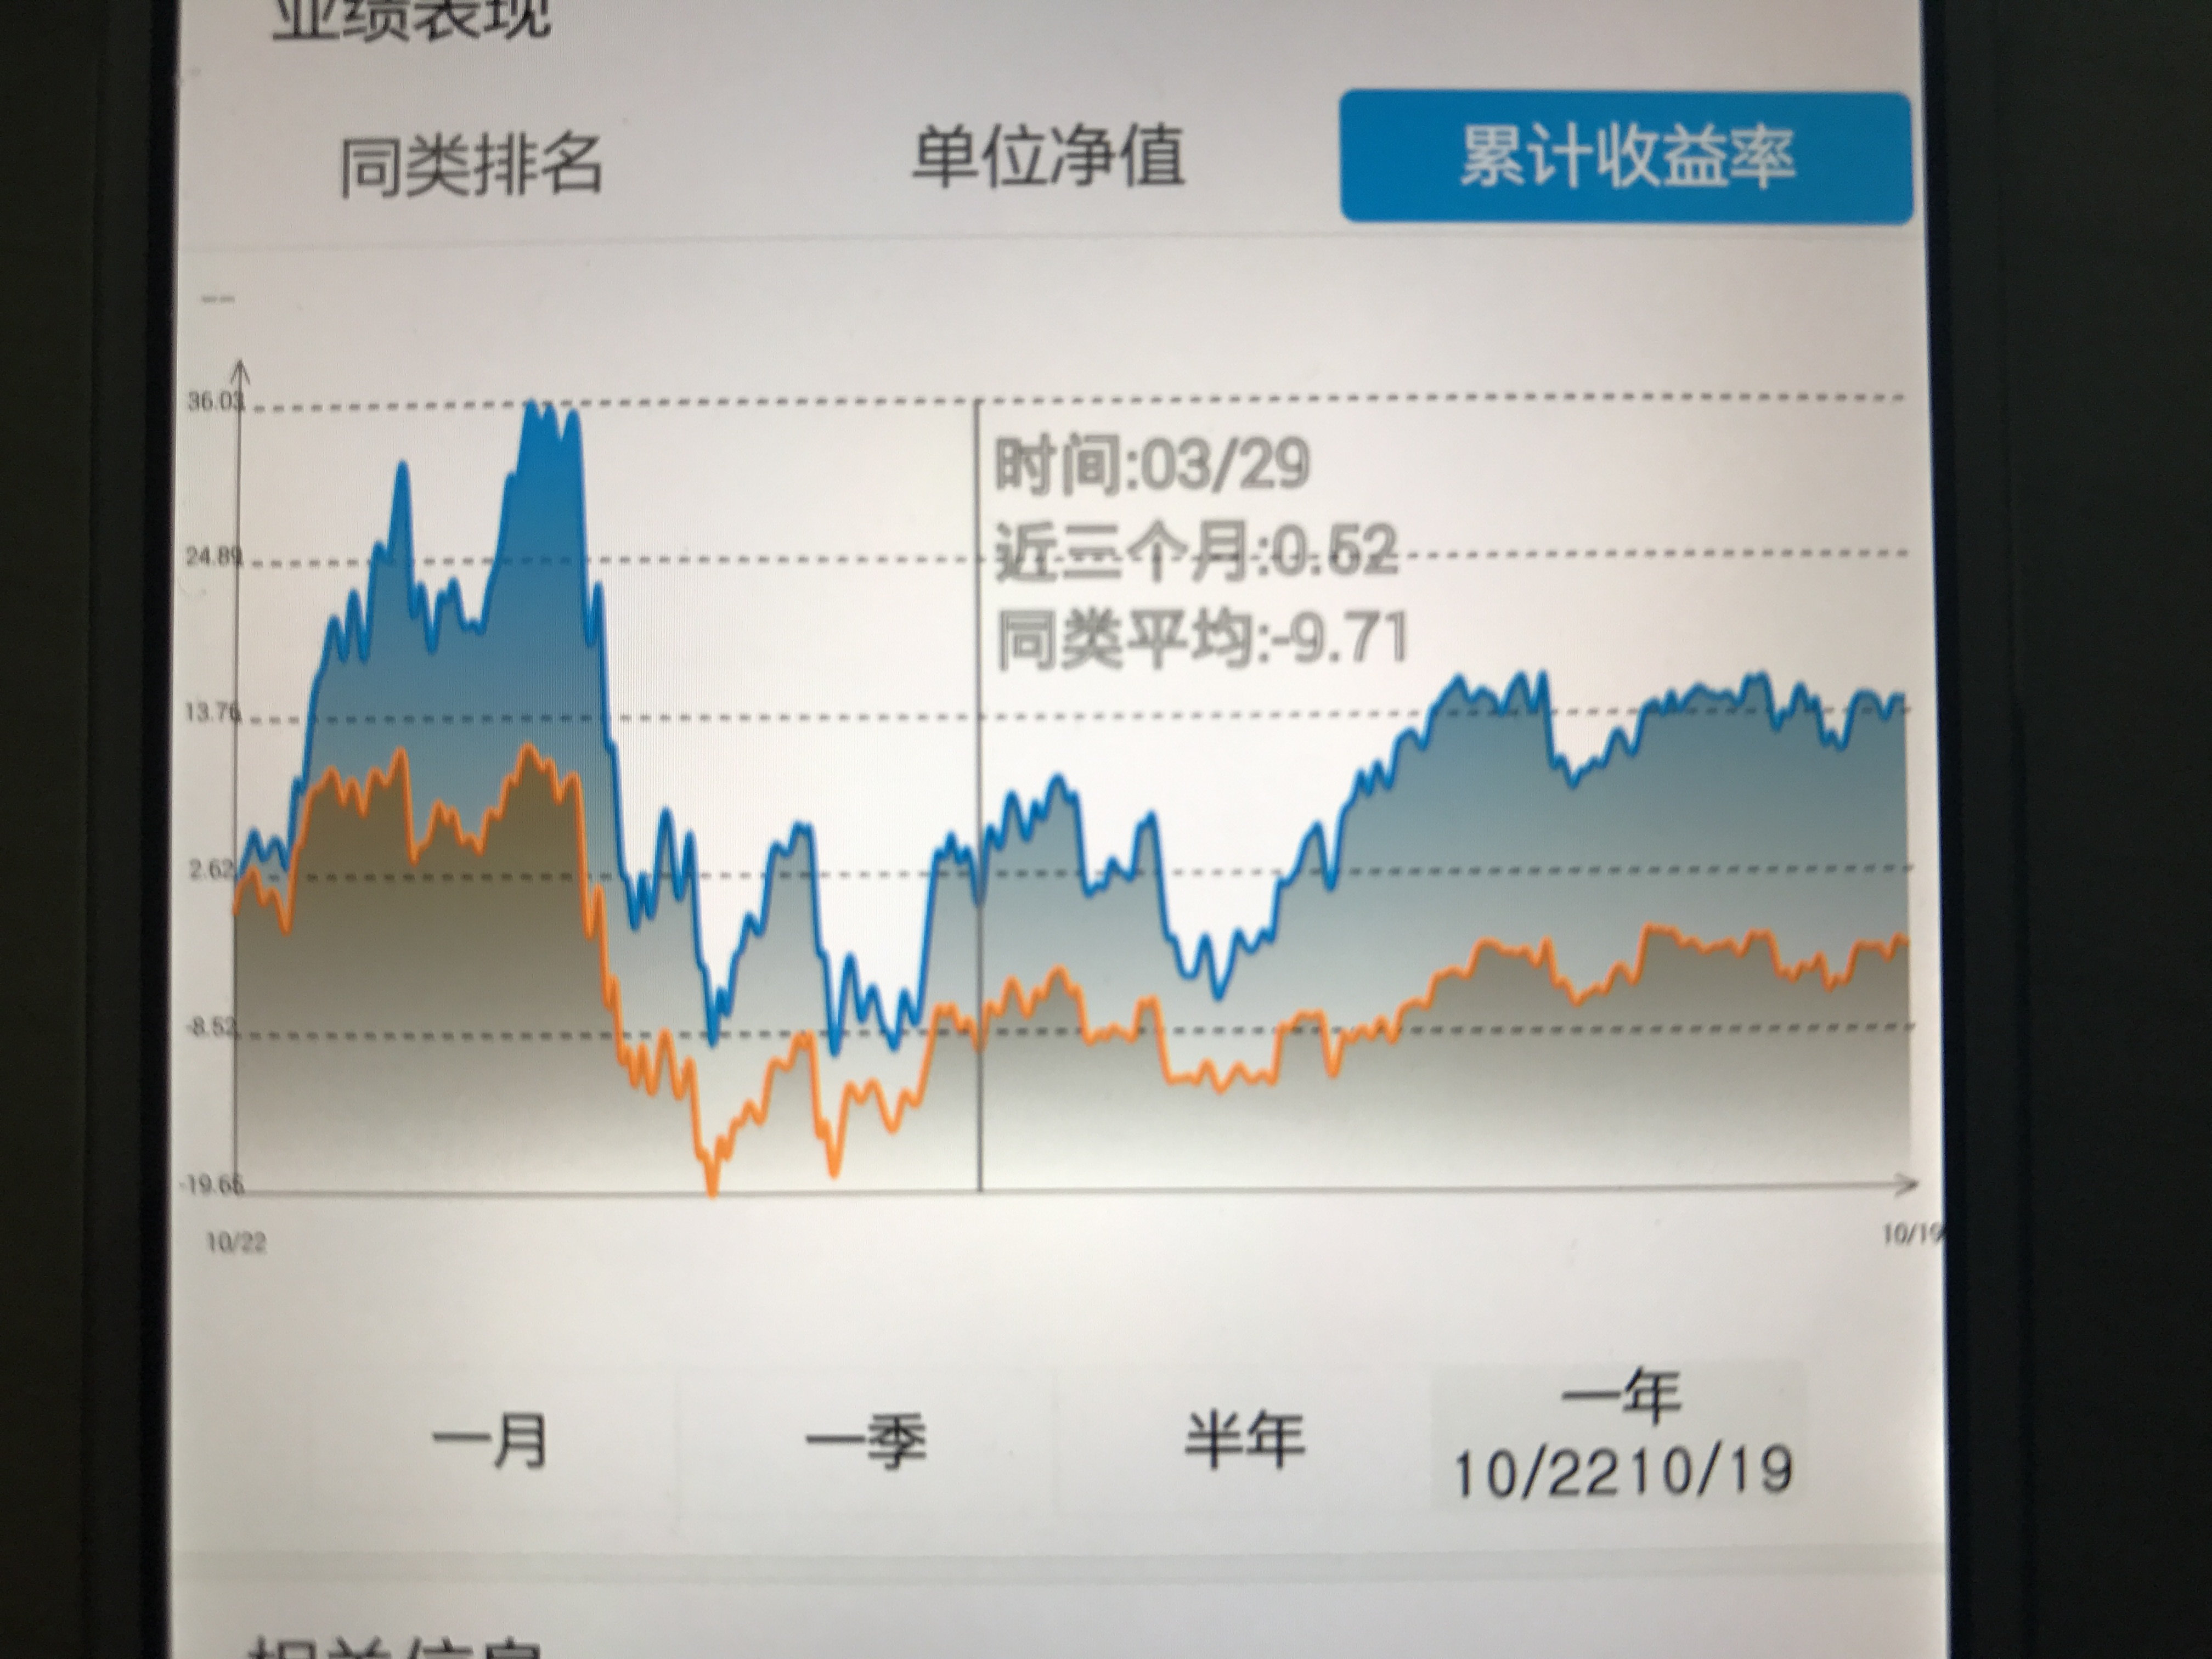
public class BaseFundChartView extends View implements View.OnTouchListener{ Paint linePaint; Paint textPaint; Paint xyChartPaint; Paint chartLinePaint; Paint chartJianbianPaint; Paint huodongPaint; Paint huodongPaintText; List<Point> points; public BaseFundChartView(Context context, AttributeSet attrs, int defStyleAttr) { super(context, attrs, defStyleAttr); init(); } public BaseFundChartView(Context context) { this(context, null); } public BaseFundChartView(Context context, AttributeSet attrs) { this(context, attrs, 0); } PathEffect effect; Path path; private float getWidthYMax(){ return getWidth()-15; } private void init() { linePaint = new Paint(); textPaint = new Paint(); xyChartPaint = new Paint(); chartLinePaint = new Paint(); chartJianbianPaint = new Paint(); huodongPaint = new Paint(); huodongPaintText = new Paint(); //设置绘制模式为-虚线作为背景线。 effect = new DashPathEffect(new float[] { 6, 6, 6, 6, 6}, 2); //背景虚线路径. path = new Path(); //只是绘制的XY轴 linePaint.setStyle(Paint.Style.STROKE);// linePaint.setStrokeWidth((float) 0.7); linePaint.setStrokeWidth((float) 1.0); //设置线宽 linePaint.setColor(Color.BLACK); linePaint.setAntiAlias(true);// 锯齿不显示 //XY刻度上的字 textPaint.setStyle(Paint.Style.FILL);// 设置非填充 textPaint.setStrokeWidth(1);// 笔宽5像素 textPaint.setColor(Color.BLACK);// 设置为蓝笔 textPaint.setAntiAlias(true);// 锯齿不显示 textPaint.setTextAlign(Paint.Align.CENTER); textPaint.setTextSize(15); //绘制XY轴上的字:Y开关状态、X时间 xyChartPaint.setStyle(Paint.Style.FILL); xyChartPaint.setStrokeWidth(1); xyChartPaint.setColor(Color.BLUE); xyChartPaint.setAntiAlias(true); xyChartPaint.setTextAlign(Paint.Align.CENTER); xyChartPaint.setTextSize(18); //绘制的折线 chartLinePaint.setStyle(Paint.Style.STROKE); chartLinePaint.setStrokeWidth(5); chartLinePaint.setColor(Color.BLUE); chartLinePaint.setAntiAlias(true); //绘制的折线 chartJianbianPaint.setStyle(Paint.Style.FILL); chartJianbianPaint.setStrokeWidth(5); //chartJianbianPaint.setColor(Color.YELLOW); chartJianbianPaint.setAntiAlias(true); huodongPaint.setStyle(Paint.Style.STROKE); huodongPaint.setStrokeWidth((float) 3.0); //设置线宽 huodongPaint.setColor(Color.GRAY); huodongPaint.setAntiAlias(true);// 锯齿不显示 huodongPaintText.setStyle(Paint.Style.STROKE); huodongPaintText.setStrokeWidth((float) 2.0); //设置线宽 huodongPaintText.setTextSize(40); huodongPaintText.setColor(Color.GRAY); huodongPaintText.setAntiAlias(true);// 锯齿不显示 setOnTouchListener(this); } private boolean refData = true; public void setRefData(boolean refData) { this.refData = refData; } /** * 重要参数,两点之间分为几段描画,数字愈大分段越多,描画的曲线就越精细. */ private static final int STEPS = 12; float gridX,gridY,xSpace = 0,ySpace = 0,spaceYT = 0; Float yStart=null,yStop = null; Integer yCount = null; List<String> text = null; public void setText(List<String> text) { this.text = text; } public void setyCount(Integer yCount) { this.yCount = yCount; } public void setyStart(Float yStart) { this.yStart = yStart; } public void setyStop(Float yStop) { this.yStop = yStop; } String yFormat=null; public void setFormat(String yFormat){ this.yFormat = yFormat; } List<String> dateX = null; List<Float> dateY = null; List<List<Float>> data = null; List<Integer> colors = null; public void setColors(List<Integer> colors) { this.colors = colors; } public List<Float> getDateY() { return dateY; } public void setDateY(List<Float> dateY) { this.dateY = dateY; } public List<List<Float>> getData() { return data; } public void setData(List<List<Float>> data) { this.data = data; } public List<String> getDateX() { return dateX; } public void setDateX(List<String> dateX) { this.dateX = dateX; } Map<Integer,List<Cubic>> mapCacheX = new HashMap<>(); Map<Integer,List<Cubic>> mapCacheY = new HashMap<>(); @Override protected void onDraw(Canvas canvas) { super.onDraw(canvas); //基准点。 gridX = 40; gridY = getHeight() - 50; //XY间隔。 if(dateX!=null&&dateX.size()>0){ xSpace = (getWidthYMax() - gridX)/dateX.size(); } /** * 如果设置开头和结尾的话,就直接生成y轴 */ if(yStart!=null&&yStop!=null&&yCount!=null){ dateY = new ArrayList<>(); ySpace = (gridY - 70)/yCount; float ze = (yStop-yStart)/yCount; for(int i=0;i<yCount;i++){ dateY.add(yStart+ze*i); } dateY.add(yStop); if(dateY.size()>2){ spaceYT = dateY.get(1)-dateY.get(0); } }else{ if(dateY!=null&&dateY.size()>0){ ySpace = (gridY - 70)/dateY.size(); yStart = dateY.get(0); if(dateY.size()>2){ spaceYT = dateY.get(1)-dateY.get(0); } } } UIUtils.log("rewqfdesa",gridY,"fdsafdsa"); //画Y轴(带箭头)。 canvas.drawLine(gridX, gridY - 20 - 10, gridX, 10, linePaint); canvas.drawLine(gridX, 10, gridX - 6, 14 + 10, linePaint);//Y轴箭头。 canvas.drawLine(gridX, 10, gridX + 6, 14 + 10, linePaint); //画Y轴名字。 //由于是竖直显示的,先以原点顺时针旋转90度后为新的坐标系 //canvas.rotate(-90); //当xyChartPaint的setTextAlign()设置为center时第二、三个参数代表这四个字中点所在的xy坐标 //canvas.drawText("开关状态", -((float) (getHeight() - 60) - 15 - 5 - 1 / ((float) 1.6 * 1) * (getHeight() - 60) / 2), gridX - 15, xyChartPaint); //绘制Y轴坐标 //canvas.rotate(90); //改变了坐标系还要再改过来 float y = 0; //画X轴。 y = gridY - 20; canvas.drawLine(gridX, y - 10, getWidthYMax(), y - 10, linePaint);//X轴. canvas.drawLine(getWidthYMax(), y - 10, getWidthYMax() - 14, y - 6 - 10, linePaint);//X轴箭头。 canvas.drawLine(getWidthYMax(), y - 10, getWidthYMax() - 14, y + 6 - 10, linePaint); //绘制X刻度坐标。 float x = 0; if(dateX!=null){ for (int n = 0; n < dateX.size(); n++) { //取X刻度坐标. x = gridX + (n) * xSpace;//在原点(0,0)处也画刻度(不画的话就是n+1),向右移动一个跨度。 //画X轴具体刻度值。 if (dateX.get(n) != null) { //canvas.drawLine(x, gridY - 30, x, gridY - 18, linePaint);//短X刻度。 canvas.drawText(dateX.get(n), x, gridY + 5, textPaint);//X具体刻度值。 } } } float my = 0; if(dateY!=null){ for(int n=0;n<dateY.size();n++){ //取Y刻度坐标. my = gridY-30 - (n)*ySpace; UIUtils.log(my,"fdsafss",ySpace); //画y轴具体刻度值。 float day = dateY.get(n); String dayForm = String.valueOf(day); if(yFormat!=null){ dayForm = TNum.getMoney(day,yFormat); } canvas.drawText(dayForm,gridX-15,my,textPaint); if(my != gridY-30){ linePaint.setPathEffect(effect);//设法虚线间隔样式。 //画除X轴之外的------背景虚线一条------- path.moveTo(gridX, my);//背景【虚线起点】。 path.lineTo(getWidthYMax(), my);//背景【虚线终点】。 canvas.drawPath(path, linePaint); } } } if(data!=null&&data.size()>0){ float lastPointX = 0; //前一个点 float lastPointY = 0; float currentPointX = 0;//当前点 float currentPointY = 0; for(int n=0;n<data.size();n++){ List<Float> da = data.get(n); List<Float> da_x = new ArrayList<>(); List<Float> da_y = new ArrayList<>(); /** * 曲线路劲 */ Path curvePath = new Path(); /** * 渐变色路径 */ Path jianBianPath = new Path(); List<Cubic> calculate_y; List<Cubic> calculate_x; if(refData){ for(int m=0;m<da.size();m++){ currentPointX = m * xSpace + gridX; currentPointY = gridY-30 - ((da.get(m)-yStart)*(ySpace/spaceYT)); da_x.add(currentPointX); da_y.add(currentPointY);// if(m>0){// canvas.drawLine(lastPointX, lastPointY, currentPointX, currentPointY, chartLinePaint);// }// lastPointX = currentPointX;// lastPointY = currentPointY; } calculate_y = calculate(da_y); calculate_x = calculate(da_x); mapCacheY.put(n,calculate_y); mapCacheX.put(n,calculate_x); if(n>=data.size()-1){ refData = false; } }else{ calculate_y = mapCacheY.get(n); calculate_x = mapCacheX.get(n); } curvePath.moveTo(calculate_x.get(0).eval(0), calculate_y.get(0).eval(0)); jianBianPath.moveTo(gridX,gridY - 20 - 10); jianBianPath.lineTo(calculate_x.get(0).eval(0), calculate_y.get(0).eval(0)); chartLinePaint.setColor(colors.get(n)); float lastx = 0; for (int i = 0; i < calculate_x.size(); i++) { for (int j = 1; j <= STEPS; j++) { float u = j / (float) STEPS; curvePath.lineTo(calculate_x.get(i).eval(u), calculate_y.get(i) .eval(u)); jianBianPath.lineTo(calculate_x.get(i).eval(u), calculate_y.get(i) .eval(u)); lastx = calculate_x.get(i).eval(u); } } jianBianPath.lineTo(lastx,gridY - 20 - 10); canvas.drawPath(curvePath, chartLinePaint); Shader mShader = new LinearGradient(0,30 + 10,0,gridY - 20 - 10,new int[] {colors.get(n),Color.TRANSPARENT},null,Shader.TileMode.REPEAT);//新建一个线性渐变,前两个参数是渐变开始的点坐标,第三四个参数是渐变结束的点的坐标。连接这2个点就拉出一条渐变线了,玩过PS的都懂。然后那个数组是渐变的颜色。下一个参数是渐变颜色的分布,如果为空,每个颜色就是均匀分布的。最后是模式,这里设置的是循环渐变 chartJianbianPaint.setShader(mShader); canvas.drawPath(jianBianPath, chartJianbianPaint); } } if(lineX!=null){ if(text!=null&&text.size()>0){ Paint.FontMetrics metrics = huodongPaintText.getFontMetrics(); float top = metrics.top; float bootom = metrics.bottom; float h = bootom-top; float th = h + h*text.size(); float w=0; float fx = 1; if(lineX>getWidth()/2){ fx = -1; }else{ fx = 1; } for(int i=0;i<text.size();i++){ Rect rect = new Rect(); huodongPaintText.getTextBounds(text.get(i), 0, text.get(i).length(), rect); int width = rect.width();//文本的宽度 if(width>w){ w = width; } canvas.drawText(text.get(i),fx==1?lineX+10:lineX-10-width,40+ h*(i+1),huodongPaintText); } canvas.drawLine(lineX, gridY - 20 - 10, lineX, 30 + 10, huodongPaint); //canvas.drawRect(lineX,40,lineX+w*fx+20*fx,40+th,huodongPaint); } } } /** * 计算曲线. * * @param x * @return */ private List<Cubic> calculate(List<Float> x) { int n = x.size() - 1; float[] gamma = new float[n + 1]; float[] delta = new float[n + 1]; float[] D = new float[n + 1]; int i; /* * We solve the equation [2 1 ] [D[0]] [3(x[1] - x[0]) ] |1 4 1 | |D[1]| * |3(x[2] - x[0]) | | 1 4 1 | | . | = | . | | ..... | | . | | . | | 1 4 * 1| | . | |3(x[n] - x[n-2])| [ 1 2] [D[n]] [3(x[n] - x[n-1])] * * by using row operations to convert the matrix to upper triangular and * then back sustitution. The D[i] are the derivatives at the knots. */ gamma[0] = 1.0f / 2.0f; for (i = 1; i < n; i++) { gamma[i] = 1 / (4 - gamma[i - 1]); } gamma[n] = 1 / (2 - gamma[n - 1]); delta[0] = 3 * (x.get(1) - x.get(0)) * gamma[0]; for (i = 1; i < n; i++) { delta[i] = (3 * (x.get(i + 1) - x.get(i - 1)) - delta[i - 1]) * gamma[i]; } delta[n] = (3 * (x.get(n) - x.get(n - 1)) - delta[n - 1]) * gamma[n]; D[n] = delta[n]; for (i = n - 1; i >= 0; i--) { D[i] = delta[i] - gamma[i] * D[i + 1]; } /* now compute the coefficients of the cubics */ List<Cubic> cubics = new LinkedList<Cubic>(); for (i = 0; i < n; i++) { Cubic c = new Cubic(x.get(i), D[i], 3 * (x.get(i + 1) - x.get(i)) - 2 * D[i] - D[i + 1], 2 * (x.get(i) - x.get(i + 1)) + D[i] + D[i + 1]); cubics.add(c); } return cubics; } Float lineX = null; Integer temp = null; @Override public boolean onTouch(View v, MotionEvent event) { getParent().requestDisallowInterceptTouchEvent(true); switch(event.getAction()){ case MotionEvent.ACTION_DOWN: case MotionEvent.ACTION_MOVE: float zhi = (event.getX()-gridX)%xSpace; boolean fanwei = zhi>0&&zhi<xSpace; if(xSpace!=0&&(event.getX() - gridX )>0&&fanwei&&event.getX()<getWidthYMax()){ UIUtils.log("触摸到了"); int x = (int)((event.getX() - gridX )/xSpace); lineX = gridX + x*xSpace; if(temp!=null&&temp.equals(x)){ UIUtils.log("不刷新"); return true; } UIUtils.log("刷新"); temp = x; if(onFundChat!=null){ onFundChat.onRefChatText(this,x); } invalidate(); } break; } return true; } OnFundChat onFundChat = null; public interface OnFundChat{ void onRefChatText(BaseFundChartView view,int x); } public void setOnFundChat(OnFundChat onFundChat) { this.onFundChat = onFundChat; } class Cubic{ float a,b,c,d; /* a + b*u + c*u^2 +d*u^3 */ public Cubic(float a, float b, float c, float d){ this.a = a; this.b = b; this.c = c; this.d = d; } /** evaluate cubic */ public float eval(float u) { return (((d*u) + c)*u + b)*u + a; } }} 0 0
- Android 开发:绘制多条线,带缓存,带触控的图表(基金图表的实现)
- Android 开发:使用绘制基金图表类(带缓存的图表类)
- Android 开发:带触控的图表(基金图表的实现)
- Android图表的绘制基础知识
- 绘制带填充区域的图表
- android图表的实现
- android 开发:绘制复杂曲线,带渐变图表
- android绘制图表(用GraphView实现)
- android开发之图表绘制
- Android图表分析的开发
- android绘制图表(二)
- web网页的图表绘制
- matplotlib-绘制精美的图表
- matplotlib-绘制精美的图表
- 强大的图表绘制工具
- matplotlib-绘制精美的图表
- matplotlib-绘制精美的图表
- matplotlib-绘制精美的图表
- Android 开发:带触控的图表(基金图表的实现)
- [kuangbin带你飞]专题六 最小生成树 N HDU 1875
- HTTP中application/x-www-form-urlencoded字符说明
- CentOS LiveCD、LiveDVD和BinDVD区别在哪里
- 常见伪类
- Android 开发:绘制多条线,带缓存,带触控的图表(基金图表的实现)
- 图片的等比例缩放
- 10-20
- UVA 10340 All in All .
- Android 开发:使用绘制基金图表类(带缓存的图表类)
- Busybox支持中文的解决办法
- ubuntu安装搜狗输入发
- [NOIP2015]提高组初赛答案及题解
- C++每日一练(const)