Cooja Simulator
来源:互联网 发布:pvid淘宝客 编辑:程序博客网 时间:2024/05/18 21:40
Introduction
This tutorial aims at introducing the Cooja Simulator and guiding the reader in a simple debugging exercise. We are going to work with Hello World example for the debugging process. You can also study the Hello_World tutorial to get familiar with its source code.
You Will Learn
- How to run Cooja Simulator.
- How to debug an application using Cooja Simulator.
Relevant Directories
- /contiki/tools/cooja/ - This folder has Cooja Simulator source code. You can run Cooja inside this directory.
- /contiki/examples/hello-world/ - This has the source code of Hello World example.
Running Cooja Simulator
Cooja Simulator is a network simulator specifically designed for Wireless Sensor Networks. A summary of how Cooja executes binaries of different platforms (different types of nodes) and a few details about its structure can be found here:[1].
The simples way of running Cooja is executing it inside its own directory (we will see later how to execute Cooja from any working directory):
cd contiki/tools/coojaant run
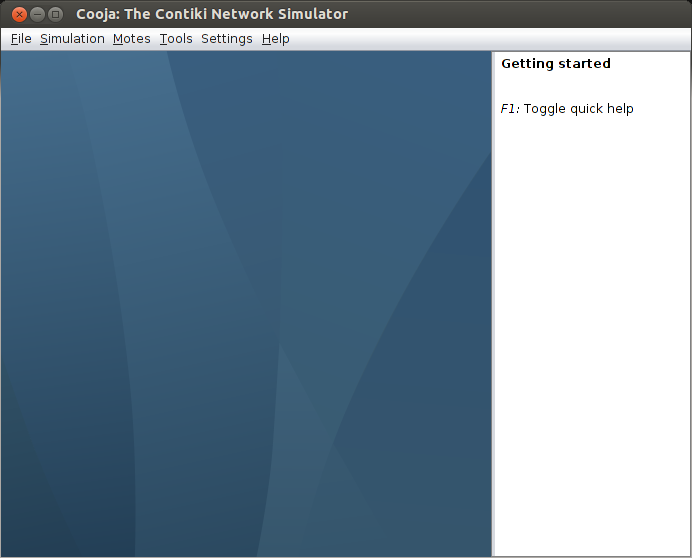
We you execute Cooja the following window pops up.
Creating a new simulation
In the File menu you can start a new simulation or open an existing one. At this moment we will start a new one. You should select: File > New simulation... The following window should show up.
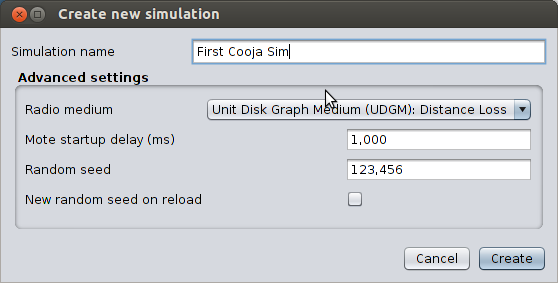
In the Simulation name box you should enter an identifier for the new simulation, and in Advanced settings you can choose parameters of the simulation such as Radio medium, node startup delay and random seed generation. We are going to create a simulation called "First Cooja Sim", as shown above.
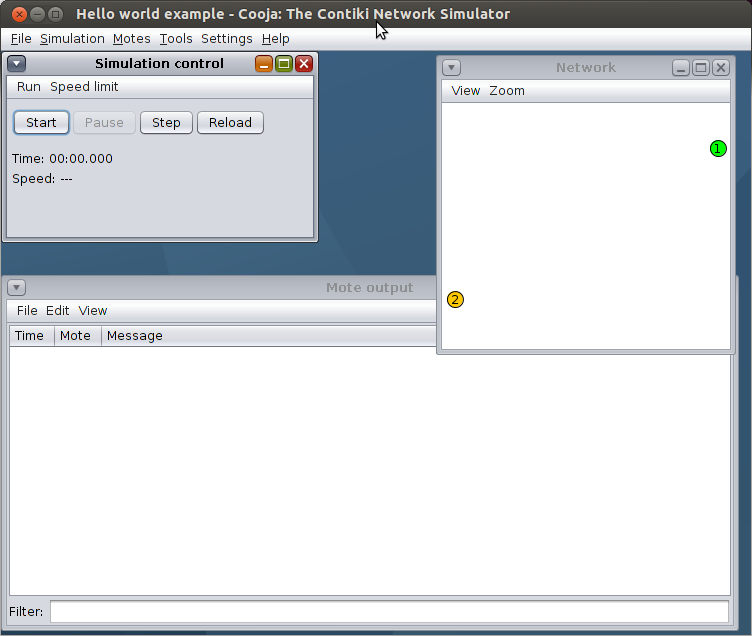
After creating a new simulation, Cooja's window is filled with the main simulating tools, as shown in the next image.
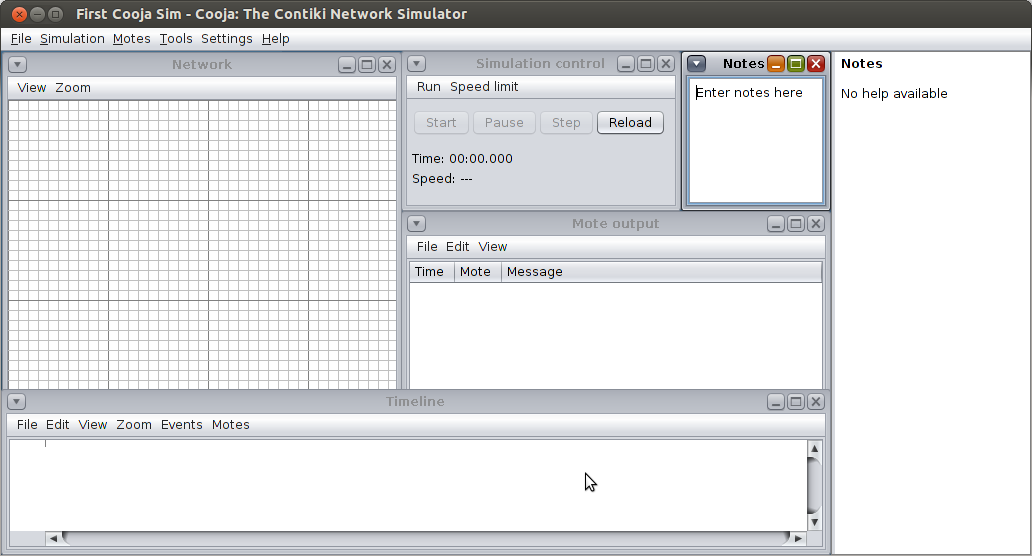
Here we briefly describe the functionalities of each tool:
- Network - Shows the location of each node in the network. Can be used to visualize the status of each node, including LEDs, mote IDs, addresses, lof outputs, etc. Initially this window is empty and we need to populate it with our sensors.
- Simulation Control - This panel is used to Start, Pause, Reload or execute Steps of the simulation. It shows the time of execution and the speed of simulation. It means that we can run the events several times faster than it would take in real-time execution.
- Notes - This is a simple notepad for taking notes about the simulation.
- Mote output - Shows all output of serial interface of the nodes. It is possible to enable one window of Mote output for each node in the simulation.
- Timeline - Simulation timeline where messages and events such as channel change, LEDs change, log outputs, etc are shown.
In addition to the default tools, it is possible to exhibit other tools such as Breakpoints, Radio messages, Script editor, Buffer view and Mote duty cycle, which can be enable in the Tools menu.
Creating a new mote type
You need to create a new mote type before starting any simulation. You can do this in the menu Motes > Add motes > Create new motes type. Let's select Sky mote in order to create a mote of the same type as the used Tmote Sky.
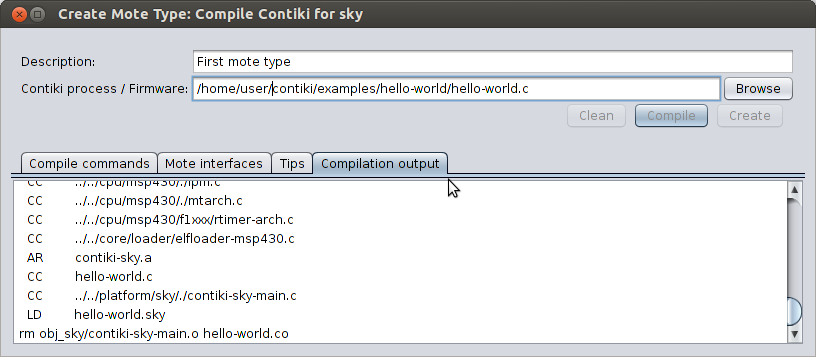
The window that shows up (see below) asks for the Description of the new mote type and the Contiki process / Firmware. You can name your mote type as First mote type and you can select the firmware that will be used during the simulation using the Browse button. After selecting the desired firmware you can test the compilation click the Compilebutton. In this example we will use the Hello World fimware, typically located at /contiki/examples/hello-world/hello-world.c. If the compiling process is successed, you will see a final message: LD hello-world.sky in the Compilation output tab.
Adding motes and running the simulation
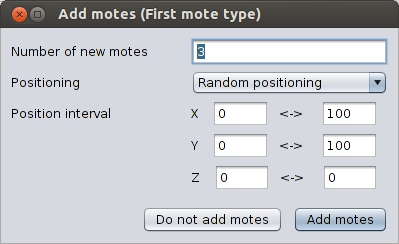
After successfully compiling the firmware in the last step you should click on Create button (see figure above). A new mote type will be created and you will be able to add a few nodes of that same type in your simulation. You will see the window shown below, where you will be able to set the number of nodes that will be created and specify their positioning. In this example we are going to create 3 new nodes and they will have random positioning.
Saving simulation file
The simulation configuration and parameters such as number of nodes, type of nodes, firmware used, location of nodes, etc. can be stored in a file for future simulations. You can save your simulation configuration in File > Save simulation as.... The generated file has extension ".csc". In the case of Hello World firmware there already exist a .csc file inside contiki/examples/hello-world, called hello-world-example.csc, which contains 2 nodes. We are going to use this pre-existing Cooja file to show how to debug an application.
Debugging with Cooja Simulator
The easiest way to debug an application is to initially create a proper .csc simulation file, as described above. Then, inside the folder with the simulation file and all firmware source code (.c and .h files), you need to execute the following command.
make TARGET=cooja <simulation_file>.cscThe command above will initialize Cooja Simulator loaded with the desired simulation file and will make Cooja recognized the source code of the application we intend to debug. In our case we are going to simulate and debug the Hello Worls application, so we need to Go into /contiki/examples/hello-world folder and execute the command make TARGET=cooja hello-world-example.csc. The window shown below should be displayed.
If we click on Start button the simulation begins and we can see both nodes printing out log messages on the Mote output window.
All debugging tools can be accessed by right-clicking on a node and selecting Mote tools for Sky in the pop-up menu. The two main debugging tools that we are going to use are:Msp Code Watcher and Msp Stack Watcher. The first one can be used for analysing the source code of the application in a step-by-step fashion, with the possibility of setting breakpoints. The second tool is used to read and write the variables used throughout the execution.
The Msp Code Watcher tool can be seen below.
Back to Contiki Tutorials
Edited by: Pedro
- Cooja Simulator
- Cooja Simulator
- Cooja Simulator拾遗
- simulator
- cooja的原理
- Contiki Cooja ant run
- 在cooja上使用collectview
- RPL UDP simulated by Cooja
- Sensor Simulator
- Racer (simulator)
- iphone simulator
- octeon simulator
- simulator balckscreen
- Concurrency Simulator
- Simulator相关
- mips-simulator
- 如何在cooja下使用collectview
- 解决新版本contiki打开cooja的问题
- 高中OJ 3794. 【NOIP2014模拟8.20】高级打字机
- Android文件上传,PHP端接收
- JavaScript中Math.random()方法生成随机数的通用函数
- 触摸屏分屏拓展屏软件(可自定义界面)
- 关于库存 &库存BAPI
- Cooja Simulator
- 你不一定知道但每天都一定用得到的:搜索自动匹配功能
- Ubuntu 配置ssh无密码登录
- Python之字典
- Windows串门之Dos常用命令
- Windows平台下markdown编辑器使用评测
- ROI区域图像叠加&初级图像混合 全剖析
- JAVA实验4
- [生存志] 第6节 第一篇 以史为鉴 明朝事的读后心得