Metron学习3_Enhancing Metron Dashboard
来源:互联网 发布:做软装用什么软件 编辑:程序博客网 时间:2024/04/30 04:37
备注:
设置Metron的页面;
Now that we have Metron configured to parse, index and persist telemetry events and Nifi pushing data to Metron, lets now visualize this streaming telemetry data in the Metron UI. We will be adding 3 new panels to visualize the Squid Events: Histogram Panel, Count Panel and Detail Panel
Step 1: Setup and Prerequisites
- Complete the instructions in Adding a new Telemetry Data Source
- Make sure the following variables are configured based on your environment:
- KAFKA_HOST = The host where a Kafka broker is installed.
- ZOOKEEPER_HOST = The host where a Zookeeper server is installed.
- PROBE_HOST = The host where your sensor, probes are installed. If don't have any sensors installed, pick the host where a Storm supervisor is running.
- SQUID_HOST = The host where you want to install SQUID. If you don't care, just install SQUID on the PROBE_HOST.
- NIFI_HOST = Host where you will install NIFI. You want this this to be same host on which you installed Squid.
- HOST_WITH_ENRICHMENT_TAG = The host in your inventory hosts file that you put under the group "enrichment."
- SEARCH_HOST = The host where you have Elastic or Solr running. This is the host in your inventory hosts file that you put under the group "search". Pick one of the search hosts.
- SEARCH_HOST_PORT = The port of the search host where indexing is configured. (e.g., 9300)
- METRON_UI_HOST = The host where your Metron UI web application is running. This is the host in your inventory hosts file that you put under the group "web."
- METRON_VERSION = The release of the Metron binaries you are working with. (e.g., 0.2.0BETA-RC2)
Step 2: Create More Squid Sensor Data
The previous tutorials covering Squid produced a limited data set. These consisted of a few basic requests. To make this tutorial more interesting, we are going to need a bit more variety in the sample data.
- ssh into SQUID_HOST as root
- Copy and paste the following set of links to a local file called `links.txt`.
https://www.amazon.com/Cards-Against-Humanity-LLC-CAHUS/dp/B004S8F7QM/ref=zg_bs_toys-and-games_home_1?pf_rd_p=2140216822&pf_rd_s=center-1&pf_rd_t=2101&pf_rd_i=home&pf_rd_m=ATVPDKIKX0DER&pf_rd_r=2231TS0FE044EZT85PQ4 https://www.amazon.com/Brain-Game-Cube-Intelligence-Development/dp/B01CRXM1JU/ref=zg_bs_toys-and-games_home_2?pf_rd_p=2140216822&pf_rd_s=center-1&pf_rd_t=2101&pf_rd_i=home&pf_rd_m=ATVPDKIKX0DER&pf_rd_r=MANXEWDTKDH2RD9Y3466 https://www.amazon.com/Zuru-Balloons-different-colors-Seconds/dp/B00ZPW3U14/ref=zg_bs_toys-and-games_home_3?pf_rd_p=2140216822&pf_rd_s=center-1&pf_rd_t=2101&pf_rd_i=home&pf_rd_m=ATVPDKIKX0DER&pf_rd_r=MANXEWDTKDH2RD9Y3466 https://www.amazon.com/MAGINOVO-Bluetooth-Headphones-Wireless-Earphones/dp/B01EFKFQL8/ref=zg_bs_electronics_home_1?pf_rd_p=2140225402&pf_rd_s=center-2&pf_rd_t=2101&pf_rd_i=home&pf_rd_m=ATVPDKIKX0DER&pf_rd_r=MANXEWDTKDH2RD9Y3466 https://www.amazon.com/Amazon-Fire-TV-Stick-Streaming-Media-Player/dp/B00GDQ0RMG/ref=zg_bs_electronics_home_2?pf_rd_p=2140225402&pf_rd_s=center-2&pf_rd_t=2101&pf_rd_i=home&pf_rd_m=ATVPDKIKX0DER&pf_rd_r=MANXEWDTKDH2RD9Y3466 http://www.walmart.com/ip/All-the-Light-We-Cannot-See/26737727 http://www.walmart.com/ip/Being-Mortal-Medicine-and-What-Matters-in-the-End/36958209 http://www.walmart.com/ip/My-Brilliant-Friend-Book-One-Childhood-Adolescence/20527482 http://www.walmart.com/ip/A-Game-of-Thrones/402949 http://www.bbc.co.uk/capital/story/20160622-there-are-people-making-millions-from-your-pets-poo http://www.bbc.co.uk/earth/story/20160620-can-we-predict-the-time-of-our-death http://www.bbc.co.uk/news/uk-england-somerset-36596557
- Run this command to choose one of the links above at random and make a request for that link through Squid. Leave this command running in a terminal so that a continual feed of data is generated as we work through the remainder of this tutorial.
while sleep 2; do cat links.txt | shuf -n 1 | xargs -i squidclient -g 4 -v {}; done - The previous command is generating log records at `/var/log/squid/access.log`. As long as Nifi is still running that we created in Adding a new Telemetry Data Source these event should be pushed to Metron's Telemetry Ingest layer
- . Ensure that the parser topology for Squid continues to run based on the steps outlined in the previous tutorials.
Step 3: Create an Index Template
To work with the Squid data in Kibana, we need to ensure that the data is landing in the search index with the correct data types. This can be achieved by defining an index template.
- Run the following command to create an index template for Squid.
curl -XPOST $SEARCH_HOST:$SEARCH_PORT/_template/squid_index -d ' { "template": "squid_index*", "mappings": { "bro_doc": { "_timestamp": { "enabled": true }, "properties": { "timestamp": { "type": "date", "format": "epoch_millis" }, "source:type": { "type": "string", "index": "not_analyzed" }, "action": { "type": "string", "index": "not_analyzed" }, "bytes": { "type": "integer" }, "code": { "type": "string", "index": "not_analyzed" }, "domain_without_subdomains": { "type": "string", "index": "not_analyzed" }, "full_hostname": { "type": "string", "index": "not_analyzed" }, "elapsed": { "type": "integer" }, "method": { "type": "string", "index": "not_analyzed" }, "ip_dst_addr": { "type": "string", "index": "not_analyzed" } } } } }' - By default, Elasticsearch will attempt to analyze all fields of type string. This means that Elasticsearch will tokenize the string and perform additional processing to enable free-form text search. In many cases, and all cases for the Squid data, we want to treat each of the string fields as enumerations. This is why most fields in the index template are `not_analyzed`.
- An index template will only apply for indices that are created after the template is created. Delete the existing Squid indices so that new ones can be generated with the index template.
curl -XDELETE $SEARCH_HOST:9200/squid*
- Wait for the Squid index to be re-created. This may take a minute or two based on how fast the Squid data is being consumed in your environment.
curl -XGET node1:9200/squid*
Step 4: Configure the Squid Index in Kibana
Now that we have a Squid index with all of the right data types, we need to tell Kibana about this index.

Click on the image above to see each of these steps performed.
1. Login to your Kibana user interface http://METRON_UI_HOST:5000 and then click on 'Settings', then 'Indices'.
2. A text field will prompt for the name of the index. Type `squid*` within the text field. Every hour or day, depending on the specific configuration, a new Squid index will be created. Using this pattern will match against all Squid indices for all time periods.
3. Click outside of that text box and wait for the 'Time-field name' input field to populate. Since there is only one timestamp in the index, this should default to a field called `timestamp`. If this does not happen simply choose the field `timestamp`.
4. Then click the 'Create' button.
Step 5: Review the Squid Data
Now that Kibana is aware of the new Squid index, let's take a look at the data.

Click on the image above to see each of these steps performed.
1. Click on `Discover` and then choose the newly created `squid*` index pattern.
2. By clicking any of the fields on the left menu, you can see a representation of the variety of data for that specific fields.
3. Clicking on a specific record will show each field available in the data.
Step 6: Adding Squid Event Count Panel to Dashboard
- Log into the Metron UI Dashboard: http://METRON_UI_HOST:5000
- Select "Visualize" Tab --> Select "Metric" Visualization"= --> Select "From a new search" for Search Source --> Select "squid*" index source –> Click the Save disk icon on the top right
- Name the Visualization "Squid Event Count" and click Save
- Select "Dashboard" Tab --> Click the plus icon --> Select "Visualization" tab --> Search for "Squid Event Count" --> Select it
- The visualization will be added to the bottom of the dashboard
- Click the save icon on the top right to save the dashboard.
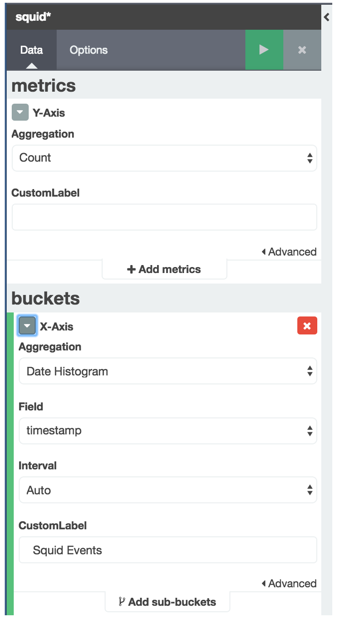
Step 7: Creating a Histogram Panel
- Log into the Metron UI Dashboard: http://METRON_UI_HOST:5000
- Select "Visualize" Tab --> Select "Line Chart" Visualization --> Select "From a new search" for Search Source --> Select "squid*" index source
- Configure the Visualization like the following:
- Click the Save Icon on the right right corner --> Name the Visualization "Squid Events Histogram" and click Save
- Select "Dashboard" Tab --> Click the plus icon --> Select "Visualization" tab --> Search for "Squid Events Histogram" --> Select it
- The visualization will be added to the bottom of the dashboard
- Click the save icon on the top right to save the dashboard.
Step 8: Adding a Detail Panel
- Log into the Metron UI Dashboard: http://METRON_UI_HOST:5000
- Select "Discover" Tab --> Select the "squid*" index
- Search for only docs in this index with type of squid_doc
- Type the following in search "_type: squid_doc"
- click the search icon
- Now we only to select subset of the fields that we want to display in the detail panel. In the left hand panel under "Available Fields", "add" the following fields:
- full_hostname
- ip_src_addr
- ip_dst_addr
- original_string
- method
- type
- The discover/search panel should look something like the following:
- Click the "Save" icon on the top right corner --> name the search "Squid Event Details" --> Click Save
- Select "Dashboard" Tab --> Click the plus icon --> Select "Searches" tab --> Search for "Squid Event Details" --> Select it
- The visualization will be added to the bottom of the dashboard
- Click the save icon on the top right to save the dashboard.

Step 9: The Dashboard with the 3 Squid Panels
The following is what the new dashboard would look like with the 3 squid panels added.

Summary
At this point you should be comfortable customizing a dashboard as you add new sources of telemetry to Metron. This article introduced Metron's default dashboard that is built upon Kibana 4. It covered the elements present in the dashboard and how you can extend the dashboard for your own purposes.
原文来自:https://cwiki.apache.org/confluence/display/METRON/Enhancing+Metron+Dashboard
- Metron学习3_Enhancing Metron Dashboard
- Metron学习9_Apache Metron学习记录
- Metron学习5_Install/Deploy Metron to the Cluster过程及出现的问题
- Metron学习10_Deploying a fresh Metron cluster via Ambari Management pack
- Apache Metron Proposal
- Metron(一)
- Metron学习1_安全大数据分析框架 OpenSOC
- Metron学习2_Metron Installation on an Ambari-Managed Cluster
- Metron学习4_Ansible Based Vagrant Single Node VM Install
- Metron学习11_Metron with HDP 2.5 bare-metal install
- Metron学习8_使用Metron安装Elasticsearch后,启动时No interface named 'eth1' found报错
- Metron学习7_Metron安装过后,一些被安装工具的位置
- Metron学习6_No interface named 'eth0' found, got [name:lo (lo), name:em1 (em1)]错误解决
- Apache Metron Meetup May 4, 2016 - Big data cybersecurity
- Metron安装方式的一种,基于Ambari集群安装
- Operation dashboard 学习总结
- Openstack学习笔记(五)-OpenStack Dashboard开发环境搭建
- Flex Dashboard
- alias命令--Linux命令应用大词典729个命令解读
- 正在加载8
- Android小知识(2)
- 正在加载9
- Android开发之Activity总结(三)
- Metron学习3_Enhancing Metron Dashboard
- Macros for Build Commands and Properties
- 正在加载10
- PHP 易错知识点整理
- Android LayoutInflater详解
- tomcat 6x and 7x https配置
- TLS/SSL 及 HTTPS
- ActiveMq和SpringmVC 整合 消息队列(上)
- 数据库建表时一定要设置外键约束关系吗?