Linux下的内核测试工具——perf使用简介
来源:互联网 发布:淘宝网店代理商 编辑:程序博客网 时间:2024/05/24 01:48
摘要:Perf是Linux kernel自带的系统性能优化工具。Perf的优势在于与Linux Kernel的紧密结合,它可以最先应用到加入Kernel的new feature。pef可以用于查看热点函数,查看cashe miss的比率,从而帮助开发者来优化程序性能。
1.perf的安装
由于我们经常是在自己编译的内核上进行开发工作,这里需要有包含调式信息的内核启动镜像文件vmlinux,在自定义内核的基础之上,进入linux内核源码,linux/tools/perf
make
make install
提示:
1)可能在编译的时候,有报错大概是由于平台问题,数据类型不匹配,导致所有的warning都被当作error对待:出现这问题的原因是-Werror这个gcc编译选项。只要在makefile中找到包含这个-Werror选项的句子,将-Werror删除,或是注释掉就行了
2)安装完毕,perf可执行程序往往位于当前目录,可能不在系统的PATH路径中,此时需要改变环境变量PATH
2.perf的运行原理
性能调优工具如 perf,Oprofile 等的基本原理都是对被监测对象进行采样,最简单的情形是根据 tick 中断进行采样,即在 tick 中断内触发采样点,在采样点里判断程序当时的上下文。假如一个程序 90% 的时间都花费在函数 foo() 上,那么 90% 的采样点都应该落在函数 foo() 的上下文中。运气不可捉摸,但我想只要采样频率足够高,采样时间足够长,那么以上推论就比较可靠。因此,通过 tick 触发采样,我们便可以了解程序中哪些地方最耗时间,从而重点分析。
稍微扩展一下思路,就可以发现改变采样的触发条件使得我们可以获得不同的统计数据:
以时间点 ( 如 tick) 作为事件触发采样便可以获知程序运行时间的分布。
以 cache miss 事件触发采样便可以知道 cache miss 的分布,即 cache 失效经常发生在哪些程序代码中。如此等等。
因此让我们先来了解一下 perf 中能够触发采样的事件有哪些。
使用perf list(在root权限下运行),可以列出所有的采样事件

事件分为以下三种:
1)Hardware Event 是由 PMU 硬件产生的事件,比如 cache 命中,当您需要了解程序对硬件特性的使用情况时,便需要对这些事件进行采样;
2)Software Event 是内核软件产生的事件,比如进程切换,tick 数等 ;
3)Tracepoint event 是内核中的静态 tracepoint 所触发的事件,这些 tracepoint 用来判断程序运行期间内核的行为细节,比如 slab 分配器的分配次数等。
上述每一个事件都可以用于采样,并生成一项统计数据,时至今日,尚没有文档对每一个 event 的含义进行详细解释。
3.perfstat——概览程序的运行情况
面对一个问题程序,最好采用自顶向下的策略。先整体看看该程序运行时各种统计事件的大概,再针对某些方向深入细节。而不要一下子扎进琐碎细节,会一叶障目的。
有些程序慢是因为计算量太大,其多数时间都应该在使用CPU进行计算,这叫做CPUbound型;有些程序慢是因为过多的IO,这种时候其CPU利用率应该不高,这叫做IObound型;对于CPUbound程序的调优和IObound的调优是不同的。
如果您认同这些说法的话,Perfstat应该是您最先使用的一个工具。它通过概括精简的方式提供被调试程序运行的整体情况和汇总数据。
本篇中,我们将在以后使用这个例子test1.c:
测试用例:test1
<SPAN style="FONT-SIZE: 14px"> //test.c
void longa()
{
int i,j;
for(i = 0; i < 1000000; i++)
j=i; //am I silly or crazy? I feel boring and desperate.
}
void foo2()
{
int i;
for(i=0 ; i < 10; i++)
longa();
}
void foo1()
{
int i;
for(i = 0; i< 100; i++)
longa();
}
int main(void)
{
foo1();
foo2();
} </SPAN>
将它编译为可执行文件 test1
gcc – o test1 – g test.c
注意:此处一定要加-g选项,加入调试和符号表信息。
下面演示了 perf stat 针对程序 test1 的输出:
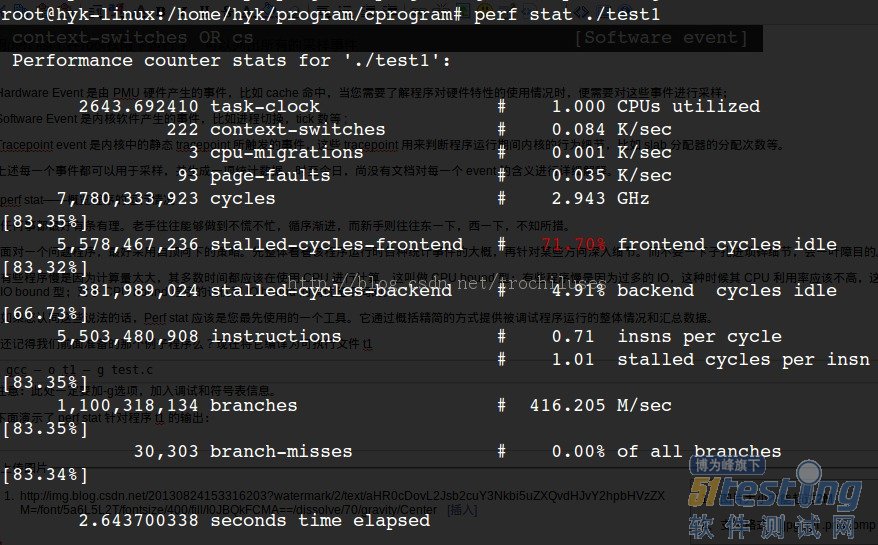
结果分析:
对 test1进行调优应该要找到热点 ( 即最耗时的代码片段 ),再看看是否能够提高热点代码的效率。
缺省情况下,除了 task-clock-msecs 之外,perf stat 还给出了其他几个最常用的统计信息:
Task-clock-msecs:CPU 利用率,该值高,说明程序的多数时间花费在 CPU 计算上而非 IO。
Context-switches:进程切换次数,记录了程序运行过程中发生了多少次进程切换,频繁的进程切换是应该避免的。
Cache-misses:程序运行过程中总体的 cache 利用情况,如果该值过高,说明程序的 cache 利用不好
CPU-migrations:表示进程 t1 运行过程中发生了多少次 CPU 迁移,即被调度器从一个 CPU 转移到另外一个 CPU 上运行。
Cycles:处理器时钟,一条机器指令可能需要多个 cycles,
Instructions: 机器指令数目。
IPC:是 Instructions/Cycles 的比值,该值越大越好,说明程序充分利用了处理器的特性。
Cache-references: cache 命中的次数
Cache-misses: cache 失效的次数。
4.精确制导——定位程序瓶颈perf record && perf report
4.1查找时间上的热点函数
perf record – e cpu-clock ./test1
perf report
3个问题:
1)perf未能定位本地符号表对应的symbol和地址的对应关系:0x000003d4对应的什么函数?
2)采样频率不够高,失去了一些函数的信息:显然一些内核函数没有显示在上面的结果中,因为采样频率如果不够高,那么势必会有一些函数中的采样点没有/
3)如何克服采样的随机性带来的问题:为了在测量更加逼近正确值,我们采用多次重复取平均值的方法来逼近真实值。(这里可以用-r来指定重复次数)
对于问题2),我们可以用perf record -F count 来指定采样频率加以解决:
<SPAN style="FONT-SIZE: 14px">root@hyk-linux:/home/hyk/program/cprogram# perf record -F 50000 -e cpu-clock ./test1[ perf record: Woken up 3 times to write data ]
[ perf record: Captured and wrote 0.532 MB perf.data (~23245 samples) ]
root@hyk-linux:/home/hyk/program/cprogram# perf report
# ========
# captured on: Mon Aug 26 09:54:45 2013
# hostname : hyk-linux
# os release : 3.10.9
# perf version : 3.10.9
# arch : i686
# nrcpus online : 4
# nrcpus avail : 4
# cpudesc : Intel(R) Core(TM) i5-2430M CPU @ 2.40GHz
# cpuid : GenuineIntel,6,42,7
# total memory : 4084184 kB
# cmdline : /media/usr/src/linux-3.10.9/tools/perf/perf record -F 50000 -e cpu-c
# event : name = cpu-clock, type = 1, config = 0x0, config1 = 0x0, config2 = 0x0
# HEADER_CPU_TOPOLOGY info available, use -I to display
# pmu mappings: cpu = 4, software = 1, tracepoint = 2, uncore_cbox_0 = 6, uncore
# ========
#
# Samples: 13K of event 'cpu-clock'
# Event count (approx.): 273580000
#
# Overhead Command Shared Object Symbol
# ........ ....... ................. ...............................
#
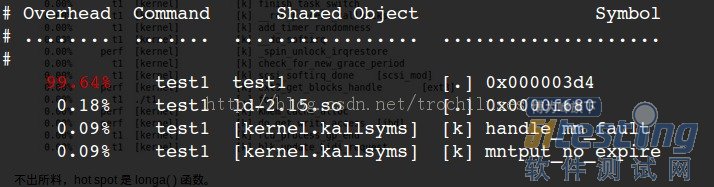
99.77% test1 test1 [.] 0x000003c3
0.07% test1 ld-2.15.so [.] 0x00004c99
0.02% test1 [kernel.kallsyms] [k] __wake_up_bit
0.01% test1 [kernel.kallsyms] [k] __kunmap_atomic
0.01% test1 [kernel.kallsyms] [k] load_elf_binary
0.01% test1 [kernel.kallsyms] [k] _raw_spin_unlock_irqrestore
0.01% test1 libc-2.15.so [.] 0x00097d8e
0.01% test1 [kernel.kallsyms] [k] exit_itimers
0.01% test1 [kernel.kallsyms] [k] profile_munmap
0.01% test1 [kernel.kallsyms] [k] get_page_from_freelist
0.01% test1 [kernel.kallsyms] [k] vma_interval_tree_remove
0.01% test1 [kernel.kallsyms] [k] change_protection
0.01% test1 [kernel.kallsyms] [k] link_path_walk
0.01% test1 [kernel.kallsyms] [k] prepend_path
0.01% test1 [kernel.kallsyms] [k] __inode_wait_for_writeback
0.01% test1 [kernel.kallsyms] [k] aa_free_task_context
0.01% test1 [kernel.kallsyms] [k] radix_tree_lookup_element
0.01% test1 [kernel.kallsyms] [k] _raw_spin_lock </SPAN>
结果解释:
The column 'Overhead' indicates the percentage of the overall samples collected in the corresponding function. The second column reports the process from which the samples were collected. In per-thread/per-process mode, this is always the name of the monitored command. But in cpu-wide mode, the command can vary. The third column shows the name of the ELF image where the samples came from. If a program is dynamically linked, then this may show the name of a shared library. When the samples come from the kernel, then the pseudo ELF image name [kernel.kallsyms] is used. The fourth column indicates the privilege level at which the sample was taken, i.e. when the program was running when it was interrupted:
[.] : user level
[k]: kernel level
[g]: guest kernel level (virtualization)
[u]: guest os user space
[H]: hypervisor
The final column shows the symbol name.
代码是非常复杂难说的,t1 程序中的 foo1() 也是一个潜在的调优对象,为什么要调用 100 次那个无聊的 longa() 函数呢?但我们在上图中无法发现 foo1 和 foo2,更无法了解他们的区别了。
我曾发现自己写的一个程序居然有近一半的时间花费在 string 类的几个方法上,string 是 C++ 标准,我绝不可能写出比 STL 更好的代码了。因此我只有找到自己程序中过多使用 string 的地方。因此我很需要按照调用关系进行显示的统计信息。
使用 perf 的 -g 选项便可以得到需要的信息:
perf record -g -e cpu-clock ./test1
perf report

当然,这里符号表没有定位的问题有依然没有解决!
perf record的其他参数:
-f:强制覆盖产生的.data数据
-c:事件每发生count次采样一次
-p:指定进程
-t:指定线程
4.2 perf report的相关参数:
-k:指定未经压缩的内核镜像文件,从而获得内核相关信息
--report:cpu按照cpu列出负载
5.使用tracepoint
当 perf 根据 tick 时间点进行采样后,人们便能够得到内核代码中的 hot spot。那什么时候需要使用 tracepoint 来采样呢?
我想人们使用 tracepoint 的基本需求是对内核的运行时行为的关心,如前所述,有些内核开发人员需要专注于特定的子系统,比如内存管理模块。这便需要统计相关内核函数的运行情况。另外,内核行为对应用程序性能的影响也是不容忽视的:
以之前的遗憾为例,假如时光倒流,我想我要做的是统计该应用程序运行期间究竟发生了多少次系统调用。在哪里发生的?
下面我用 ls 命令来演示 sys_enter 这个 tracepoint 的使用:
[root@ovispoly /]# perf stat -e raw_syscalls:sys_enter lsbin dbg etc lib media opt root
selinux sys usr
boot dev home lost+found mnt proc sbin srv
tmp var
Performance counter stats for 'ls':
101 raw_syscalls:sys_enter
0.003434730 seconds time elapsed
[root@ovispoly /]# perf record -e raw_syscalls:sys_enter ls
[root@ovispoly /]# perf report
Failed to open .lib/ld-2.12.so, continuing without symbols
# Samples: 70
#
# Overhead Command Shared Object Symbol
# ........ ............... ............... ......
#
97.14% ls ld-2.12.so [.] 0x0000000001629d
2.86% ls [vdso] [.] 0x00000000421424
#
# (For a higher level overview, try: perf report --sort comm,dso)
#
这个报告详细说明了在 ls 运行期间发生了多少次系统调用 ( 上例中有 101 次 ),多数系统调用都发生在哪些地方 (97% 都发生在 ld-2.12.so 中 )。
有了这个报告,或许我能够发现更多可以调优的地方。比如函数 foo() 中发生了过多的系统调用,那么我就可以思考是否有办法减少其中有些不必要的系统调用。
您可能会说 strace 也可以做同样事情啊,的确,统计系统调用这件事完全可以用 strace 完成,但 perf 还可以干些别的,您所需要的就是修改 -e 选项后的字符串。
罗列 tracepoint 实在是不太地道,本文当然不会这么做。但学习每一个 tracepoint 是有意义的,类似背单词之于学习英语一样,是一项缓慢痛苦却不得不做的事情。'
5.2同样,我们跟踪一下wirteback子系统的相关情况:
<SPAN style="FONT-SIZE: 14px">root@hyk-linux:/home/hyk/program/cprogram# perf record -e writeback:* lsa.out cscope.po.out perf.data.old t2.c test1 testperfcscope.in.out malloc.c t1 tags test1s testperf.c
cscope.out perf.data t2 test test.img
[ perf record: Woken up 1 times to write data ]
[ perf record: Captured and wrote 0.013 MB perf.data (~548 samples) ]
root@hyk-linux:/home/hyk/program/cprogram# perf report
# ========
# captured on: Mon Aug 26 08:59:58 2013
# hostname : hyk-linux
# os release : 3.10.9
# perf version : 3.10.9
# arch : i686
# nrcpus online : 4
# nrcpus avail : 4
# cpudesc : Intel(R) Core(TM) i5-2430M CPU @ 2.40GHz
# cpuid : GenuineIntel,6,42,7
# total memory : 4084184 kB
# cmdline : /media/usr/src/linux-3.10.9/tools/perf/perf record -e writeback:* ls
# event : name = writeback:writeback_dirty_page, type = 2, config = 0x291, confi
# event : name = writeback:writeback_dirty_inode_start, type = 2, config = 0x290
# event : name = writeback:writeback_dirty_inode, type = 2, config = 0x28f, conf
# event : name = writeback:writeback_write_inode_start, type = 2, config = 0x28e
# event : name = writeback:writeback_write_inode, type = 2, config = 0x28d, conf
# event : name = writeback:writeback_queue, type = 2, config = 0x28c, config1 =
# event : name = writeback:writeback_exec, type = 2, config = 0x28b, config1 = 0
# event : name = writeback:writeback_start, type = 2, config = 0x28a, config1 =
# event : name = writeback:writeback_written, type = 2, config = 0x289, config1
# event : name = writeback:writeback_wait, type = 2, config = 0x288, config1 = 0
# event : name = writeback:writeback_pages_written, type = 2, config = 0x287, co
# event : name = writeback:writeback_nowork, type = 2, config = 0x286, config1 =
# event : name = writeback:writeback_wake_background, type = 2, config = 0x285,
# event : name = writeback:writeback_bdi_register, type = 2, config = 0x284, con
# event : name = writeback:writeback_bdi_unregister, type = 2, config = 0x283, c
# event : name = writeback:wbc_writepage, type = 2, config = 0x282, config1 = 0x
# event : name = writeback:writeback_queue_io, type = 2, config = 0x281, config1
# event : name = writeback:global_dirty_state, type = 2, config = 0x280, config1
# event : name = writeback:bdi_dirty_ratelimit, type = 2, config = 0x27f, config
# event : name = writeback:balance_dirty_pages, type = 2, config = 0x27e, config
# event : name = writeback:writeback_sb_inodes_requeue, type = 2, config = 0x27d
# event : name = writeback:writeback_congestion_wait, type = 2, config = 0x27c,
# event : name = writeback:writeback_wait_iff_congested, type = 2, config = 0x27
# event : name = writeback:writeback_single_inode_start, type = 2, config = 0x27
# event : name = writeback:writeback_single_inode, type = 2, config = 0x279, con
# HEADER_CPU_TOPOLOGY info available, use -I to display
# pmu mappings: cpu = 4, software = 1, tracepoint = 2, uncore_cbox_0 = 6, uncore
# ========
#
# Samples: 0 of event 'writeback:writeback_dirty_page'
# Event count (approx.): 0
#
# Overhead Command Shared Object Symbol
# ........ ....... ............. ......
#
# Samples: 1 of event 'writeback:writeback_dirty_inode_start'
# Event count (approx.): 1
#
# Overhead Command Shared Object Symbol
# ........ ....... ................. ......................
#
100.00% ls [kernel.kallsyms] [k] __mark_inode_dirty
# Samples: 1 of event 'writeback:writeback_dirty_inode'
# Event count (approx.): 1
#
# Overhead Command Shared Object Symbol
# ........ ....... ................. ......................
#
100.00% ls [kernel.kallsyms] [k] __mark_inode_dirty
# Samples: 0 of event 'writeback:writeback_write_inode_start'
# Event count (approx.): 0
#
# Overhead Command Shared Object Symbol
# ........ ....... ............. ......
#
# Samples: 0 of event 'writeback:writeback_write_inode'
# Event count (approx.): 0
#
# Overhead Command Shared Object Symbol
# ........ ....... ............. ......
#
# Samples: 0 of event 'writeback:writeback_queue'
# Event count (approx.): 0
#
# Overhead Command Shared Object Symbol
# ........ ....... ............. ......
#
# Samples: 0 of event 'writeback:writeback_exec'
# Event count (approx.): 0
#
# Overhead Command Shared Object Symbol
# ........ ....... ............. ......
#
# Samples: 0 of event 'writeback:writeback_start'
# Event count (approx.): 0
#
# Overhead Command Shared Object Symbol
# ........ ....... ............. ......
#
# Samples: 0 of event 'writeback:writeback_written'
# Event count (approx.): 0
#
# Overhead Command Shared Object Symbol
# ........ ....... ............. ......
#
# Samples: 0 of event 'writeback:writeback_wait'
# Event count (approx.): 0
#
# Overhead Command Shared Object Symbol
# ........ ....... ............. ......
#
# Samples: 0 of event 'writeback:writeback_pages_written'
# Event count (approx.): 0
#
# Overhead Command Shared Object Symbol
# ........ ....... ............. ......
#
# Samples: 0 of event 'writeback:writeback_nowork'
# Event count (approx.): 0
#
# Overhead Command Shared Object Symbol
# ........ ....... ............. ......
#
# Samples: 0 of event 'writeback:writeback_wake_background'
# Event count (approx.): 0
#
# Overhead Command Shared Object Symbol
# ........ ....... ............. ......
#
# Samples: 0 of event 'writeback:writeback_bdi_register'
# Event count (approx.): 0
#
# Overhead Command Shared Object Symbol
# ........ ....... ............. ......
#
# Samples: 0 of event 'writeback:writeback_bdi_unregister'
# Event count (approx.): 0
#
# Overhead Command Shared Object Symbol
# ........ ....... ............. ......
#
# Samples: 0 of event 'writeback:wbc_writepage'
# Event count (approx.): 0
#
# Overhead Command Shared Object Symbol
# ........ ....... ............. ......
#
# Samples: 0 of event 'writeback:writeback_queue_io'
# Event count (approx.): 0
#
# Overhead Command Shared Object Symbol
# ........ ....... ............. ......
#
# Samples: 0 of event 'writeback:global_dirty_state'
# Event count (approx.): 0
#
# Overhead Command Shared Object Symbol
# ........ ....... ............. ......
#
# Samples: 0 of event 'writeback:bdi_dirty_ratelimit'
# Event count (approx.): 0
#
# Overhead Command Shared Object Symbol
# ........ ....... ............. ......
#
# Samples: 0 of event 'writeback:balance_dirty_pages'
# Event count (approx.): 0
#
# Overhead Command Shared Object Symbol
# ........ ....... ............. ......
#
# Samples: 0 of event 'writeback:writeback_sb_inodes_requeue'
# Event count (approx.): 0
#
# Overhead Command Shared Object Symbol
# ........ ....... ............. ......
#
# Samples: 0 of event 'writeback:writeback_congestion_wait'
# Event count (approx.): 0
#
# Overhead Command Shared Object Symbol
# ........ ....... ............. ......
</SPAN>
- linux下的内核测试工具——perf使用简介
- linux下的内核测试工具——perf使用简介
- linux下的内核测试工具——perf使用简介
- linux下的内核测试工具——perf使用简介
- linux下的内核测试工具——perf使用简介
- linux下的内核测试工具——perf使用简介
- Linux下的内核测试工具——perf使用简介
- Linux下的内核测试工具——perf使用简介
- Linux下的内核测试工具——perf使用简介
- Perf -- Linux下的性能分析工具
- Linux下的系统性能调优工具——Perf
- Linux下的系统性能调优工具——Perf
- Perf -- Linux下的系统性能调优工具介绍
- Perf -- Linux下的系统性能调优工具介绍
- Perf -- Linux下的系统性能调优工具
- Perf -- Linux下的系统性能调优工具
- Perf -- Linux下的系统性能调优工具(一)
- Perf -- Linux下的系统性能调优工具
- Android高效加载大图、多图解决方案,有效避免程序OOM
- Linux 安装MYSQLdb
- MySQL的sql_mode合理设置
- Android屏幕适配
- 将Sublime Text 添加到右键菜单的方法
- Linux下的内核测试工具——perf使用简介
- 记录
- 常用正则表达式大全 (转)
- Centos中完全删除mysql的方法
- Android将String保存为SD卡中TXT文件
- 浅谈Java多线程的同步问题
- hadoop 2.x 集群搭建
- logistic函数是softmax函数的一个特例
- AS技巧合集「编码技巧篇」