03_4Pandas_绘图
来源:互联网 发布:jqplot 动态数据 编辑:程序博客网 时间:2024/06/10 16:54
Pandas的绘图函数
说起绘图,之前的笔记中讲过Matplotlib。这是相对“低级”的绘图工具,需要自己完成基础组件的组装,如图例,标题,标签。
本文要介绍的是Pandas绘图函数,它会更高效,更简单,只需要根据数据的索引,标签进行绘图。
这里主要介绍3类图像的绘制:线形图,柱状图,散布矩阵。
了解与学习更多pandas绘图的知识,可以参看链接:
http://pandas.pydata.org/pandas-docs/version/0.18.1/visualization.html
import pandas as pdimport numpy as np%matplotlib inline1. 线形图
1.1 Series绘制线形图
# 创建Seriesser_obj = pd.Series(np.random.randn(10).cumsum())ser_obj.head()0 -1.8282821 -2.6396942 -2.0371593 -2.0402134 -2.962847dtype: float64# 直接绘制这个Seriesser_obj.plot()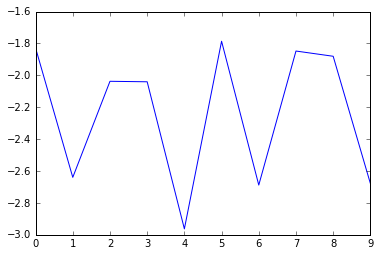
1.2 DataFrame绘制线形图
DataFrame绘制线性图时,会将每一列作为一条线,所有列的线都放在一个二维坐标内。
df_obj = pd.DataFrame(np.random.randn(10, 5), columns = ['a', 'b', 'c', 'd', 'e'])print df_obj.head() a b c d e0 -0.880582 0.223965 -0.834795 2.861881 0.7015451 -0.130621 1.550147 -0.043491 -0.557272 1.4898582 0.773101 -0.182104 -0.531463 0.972442 -1.2441603 1.312999 0.650941 -1.653722 -0.320968 -0.4968114 0.197994 2.521857 -0.198388 0.218862 0.984968df_obj.plot()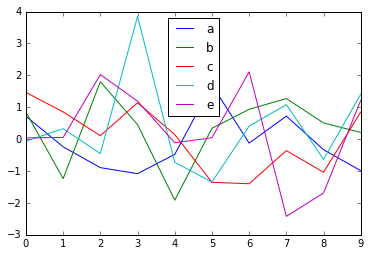

2. 柱状图
2.1 Series绘制柱状图
ser_obj.plot(kind='bar') # 选择bar表示纵向的柱状图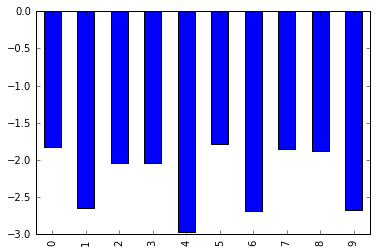
2.2 DataFrame绘制柱状图
df_obj.plot(kind='barh') # 选择barh表示横向的柱状图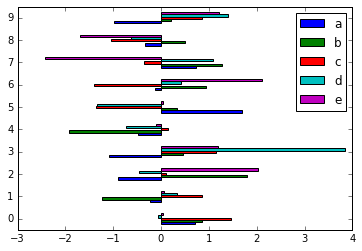

3. 散点图
pd.scatter_matrix(df_obj)array([[<matplotlib.axes._subplots.AxesSubplot object at 0x7fe9a6355250>, <matplotlib.axes._subplots.AxesSubplot object at 0x7fe9a629e6d0>, <matplotlib.axes._subplots.AxesSubplot object at 0x7fe9a6220650>, <matplotlib.axes._subplots.AxesSubplot object at 0x7fe9a6202c10>, <matplotlib.axes._subplots.AxesSubplot object at 0x7fe9a6184dd0>], [<matplotlib.axes._subplots.AxesSubplot object at 0x7fe9a61a6910>, <matplotlib.axes._subplots.AxesSubplot object at 0x7fe9a6074c10>, <matplotlib.axes._subplots.AxesSubplot object at 0x7fe9a5ff8a90>, <matplotlib.axes._subplots.AxesSubplot object at 0x7fe9a5f69190>, <matplotlib.axes._subplots.AxesSubplot object at 0x7fe9a5eeb110>], [<matplotlib.axes._subplots.AxesSubplot object at 0x7fe9a5e52050>, <matplotlib.axes._subplots.AxesSubplot object at 0x7fe9a5e45f90>, <matplotlib.axes._subplots.AxesSubplot object at 0x7fe9a5d8a110>, <matplotlib.axes._subplots.AxesSubplot object at 0x7fe9a5d35e10>, <matplotlib.axes._subplots.AxesSubplot object at 0x7fe9a5cbac90>], [<matplotlib.axes._subplots.AxesSubplot object at 0x7fe9a5c1de90>, <matplotlib.axes._subplots.AxesSubplot object at 0x7fe9a5ba0d10>, <matplotlib.axes._subplots.AxesSubplot object at 0x7fe9a5b09a10>, <matplotlib.axes._subplots.AxesSubplot object at 0x7fe9a5afbe50>, <matplotlib.axes._subplots.AxesSubplot object at 0x7fe9a5a81cd0>], [<matplotlib.axes._subplots.AxesSubplot object at 0x7fe9a59e8c10>, <matplotlib.axes._subplots.AxesSubplot object at 0x7fe9a5969a90>, <matplotlib.axes._subplots.AxesSubplot object at 0x7fe9a58d0790>, <matplotlib.axes._subplots.AxesSubplot object at 0x7fe9a585c890>, <matplotlib.axes._subplots.AxesSubplot object at 0x7fe9a57de710>]], dtype=object)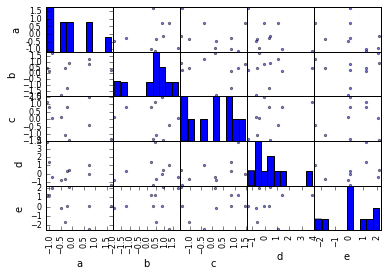
注:部分例子来自于小象学院Robin课程
0 0