用VS2017debugging(官方文档摘要)
来源:互联网 发布:医脉通官 软件 编辑:程序博客网 时间:2024/04/29 19:47
Source
Configuring a Build
two basic types of build configuration: Debug and Release.The default build configuration is Debug.can also specify a specific build platform to target, click onbuildplatform dropdown and select a different platform or Configuration Manager…
the configuration and platform values are also used to determine what project directory path is created to store the executable. For example, a project with a configuration of Debug and a platform of x86 would be found under Projects\MyProjectNameHere\MyProjectNameHere\bin\Debug\x86
Building your Code
pressF7, selecting Build->Build SolutionRebuild your project by pressing either F7 again (to recompile only the files with errors) or Ctrl+Alt+F7 (for a clean and complete rebuild).
There are two build tabbed windows in the results window below the editor: the Output window, ; and the Error List window
Reviewing the Error List
快速调出代码的行号:turn on line numbers by clicking in the Quick Launch (Ctrl+Q) bar in the upper-right, typing “line numbers” into it, and pressing Enter.UseCtrl+G to quickly jump to the line number where the error occurred.
Theerroris identified by a red “squiggle” underscore. Hover over it for additional details. Make the fix and it will go away, although you may introduce a new error with the correction. (This is called a “regression”.)
Reviewing Errors in Detail
Performing Static Code Analysis
“Static code analysis” is a fancy way of saying “automatically check my code for common problems that can lead to run-time errors or problems in code management”. Get in the habit of running it once you’ve cleaned up the obvious errors preventing build, and take some time to address the warnings it may produce. You’ll save yourself some headaches down the road, as well as learn a few code style techniques.Using Light Bulbs to Fix or Refactor Code
No quick options available here will be displayed in the lower-left corner bezel of the IDE.Light bulbs are a productivity feature in Visual Studio.

In C++, when you add a new function to a header file, you’ll see a light bulb that offers to create a stub implementation of that function.
鼠标悬停在波浪线处,或者插入点在有波浪线附近时按下Ctrl+.,灯泡就会出现。
Debugging Your Running Code
pressing F5 or selecting Debug->Start Debugging
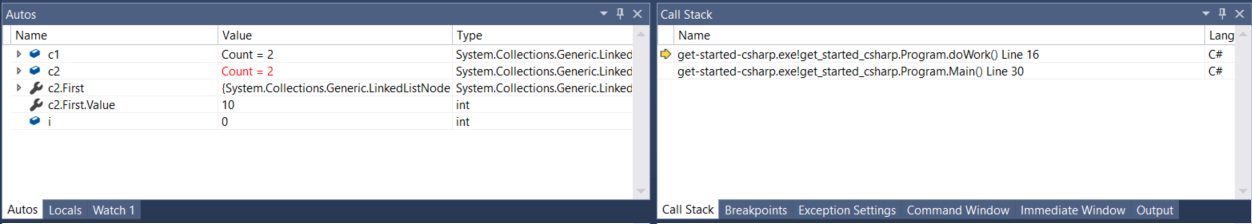
the Autos/Locals/Modules/Watch tabbed window and the Call Stack/Breakpoints/Exception Settings/Output tabbed window
pause the app by pressing Ctrl+Alt+Break (or click on the Pause button).
PressF5to continue running the app (or click the Continue button).
stop your app by pressing Shift+F5 or by clicking the Stop button, or simply close the app’s main window (or command line dialog)
Setting Simple Breakpoints
(You do NOT need to rebuild a project after setting and removing breakpoints.)
Set a breakpoint by clicking in the far margin of the line where you want the break to occur, or select the line of code and pressF9.When the code breaks, the marked line of code has not executed yet.
Using Breakpoints
Setting Conditional Breakpoints
click in the margin to set a breakpoint, and then select the “cog” from the hover menu that appears.Breakpoint Configuration Experience in Visual Studio.
Inspecting Your Code at Run-time
Usethe Diagnostic Tools window in conjunction with the Watch window and breakpointsRunning Unit Tests
Unit tests are programs that exercise code paths in your app or service. Visual Studio installs the Microsoft unit testing frameworks for both managed and native code. Use a unit testing framework to create unit tests, run them, and report the results of these tests. Rerun unit tests when you make changes to test that your code is still working correctly. When you use Visual Studio Enterprise edition, you can run tests automatically after every build.
To get started, read Generate unit tests for your code with IntelliTest.
To learn more about unit tests in Visual Studio and how they can help you create better quality code, read Unit Test Basics.
See Also
Debugging in Visual Studio
Debugger Settings and Preparation
Debug 64-Bit Applications
Debugger Basics
- 用VS2017debugging(官方文档摘要)
- mongodb官方文档摘要
- MATLAB官方文档摘要
- mysql++ 官方文档阅读简略摘要
- 【Intel(R)_Media_SDK】官方文档翻译摘要
- [bigdata-015] apache nifi 官方文档摘要
- [bigdata-080] tomcat 8.5 官方文档 摘要
- 硬件编解码(七)【Intel(R)_Media_SDK】官方文档翻译摘要
- 【甘道夫】Spark1.3.0 Submitting Applications 官方文档精华摘要
- PHP官方文档“语言参考”章节阅读摘要
- 文档摘要
- 学习 spams --- 帮助文档摘要(1)
- 抽取式文档摘要方法(一)
- 抽取式文档摘要方法(二)
- logback官方reference摘要
- 【甘道夫】Spark1.3.0 Cluster Mode Overview 官方文档精华摘要
- 【甘道夫】Spark1.3.0 Running Spark on YARN 官方文档精华摘要
- Ruby官方文档翻译(Ruby官方文档中文版)
- 线程的私有数据
- Spring入门——初步介绍
- cin、cout 与 scanf、printf 的效率比较
- 博为峰JavaEE技术文章 ——MyBatis 缓存(2)一级缓存与二级缓存
- 开通博客的第一天!
- 用VS2017debugging(官方文档摘要)
- LCM 常识
- 让mySQl的自增id从1开始的方法
- GCC __builtin_expect的作用
- POJ-2484 A Funny Game (坑爹的博弈论)
- pkg-config 介绍
- GPS定位基本原理浅析
- Linux 性能测量和调式诊断工具-- Systemtap
- luan 配置tomcat8