利用Arcgis for javascript API绘制GeoJSON并同时弹出多个Popup
来源:互联网 发布:皇室战争mac模拟器 编辑:程序博客网 时间:2024/06/18 05:02
1.引言
由于Arcgis for javascript API不可以绘制Geojson,并且提供的Popup一般只可以弹出一个,在很多专题图制作中,会遇到不少的麻烦。因此本文结合了两个现有的Arcgis for javascript API扩充库,对其进行改造达到绘制Geojson并同时弹出多个Popup的目的。
目前已有的两个扩充库github地址(可供单独使用):
1.绘制Geojson的扩充库:https://github.com/Esri/geojson-layer-js
2.多个Popup显示的扩充库:https://github.com/nickcam/PopupExtended
本文实现的效果图:
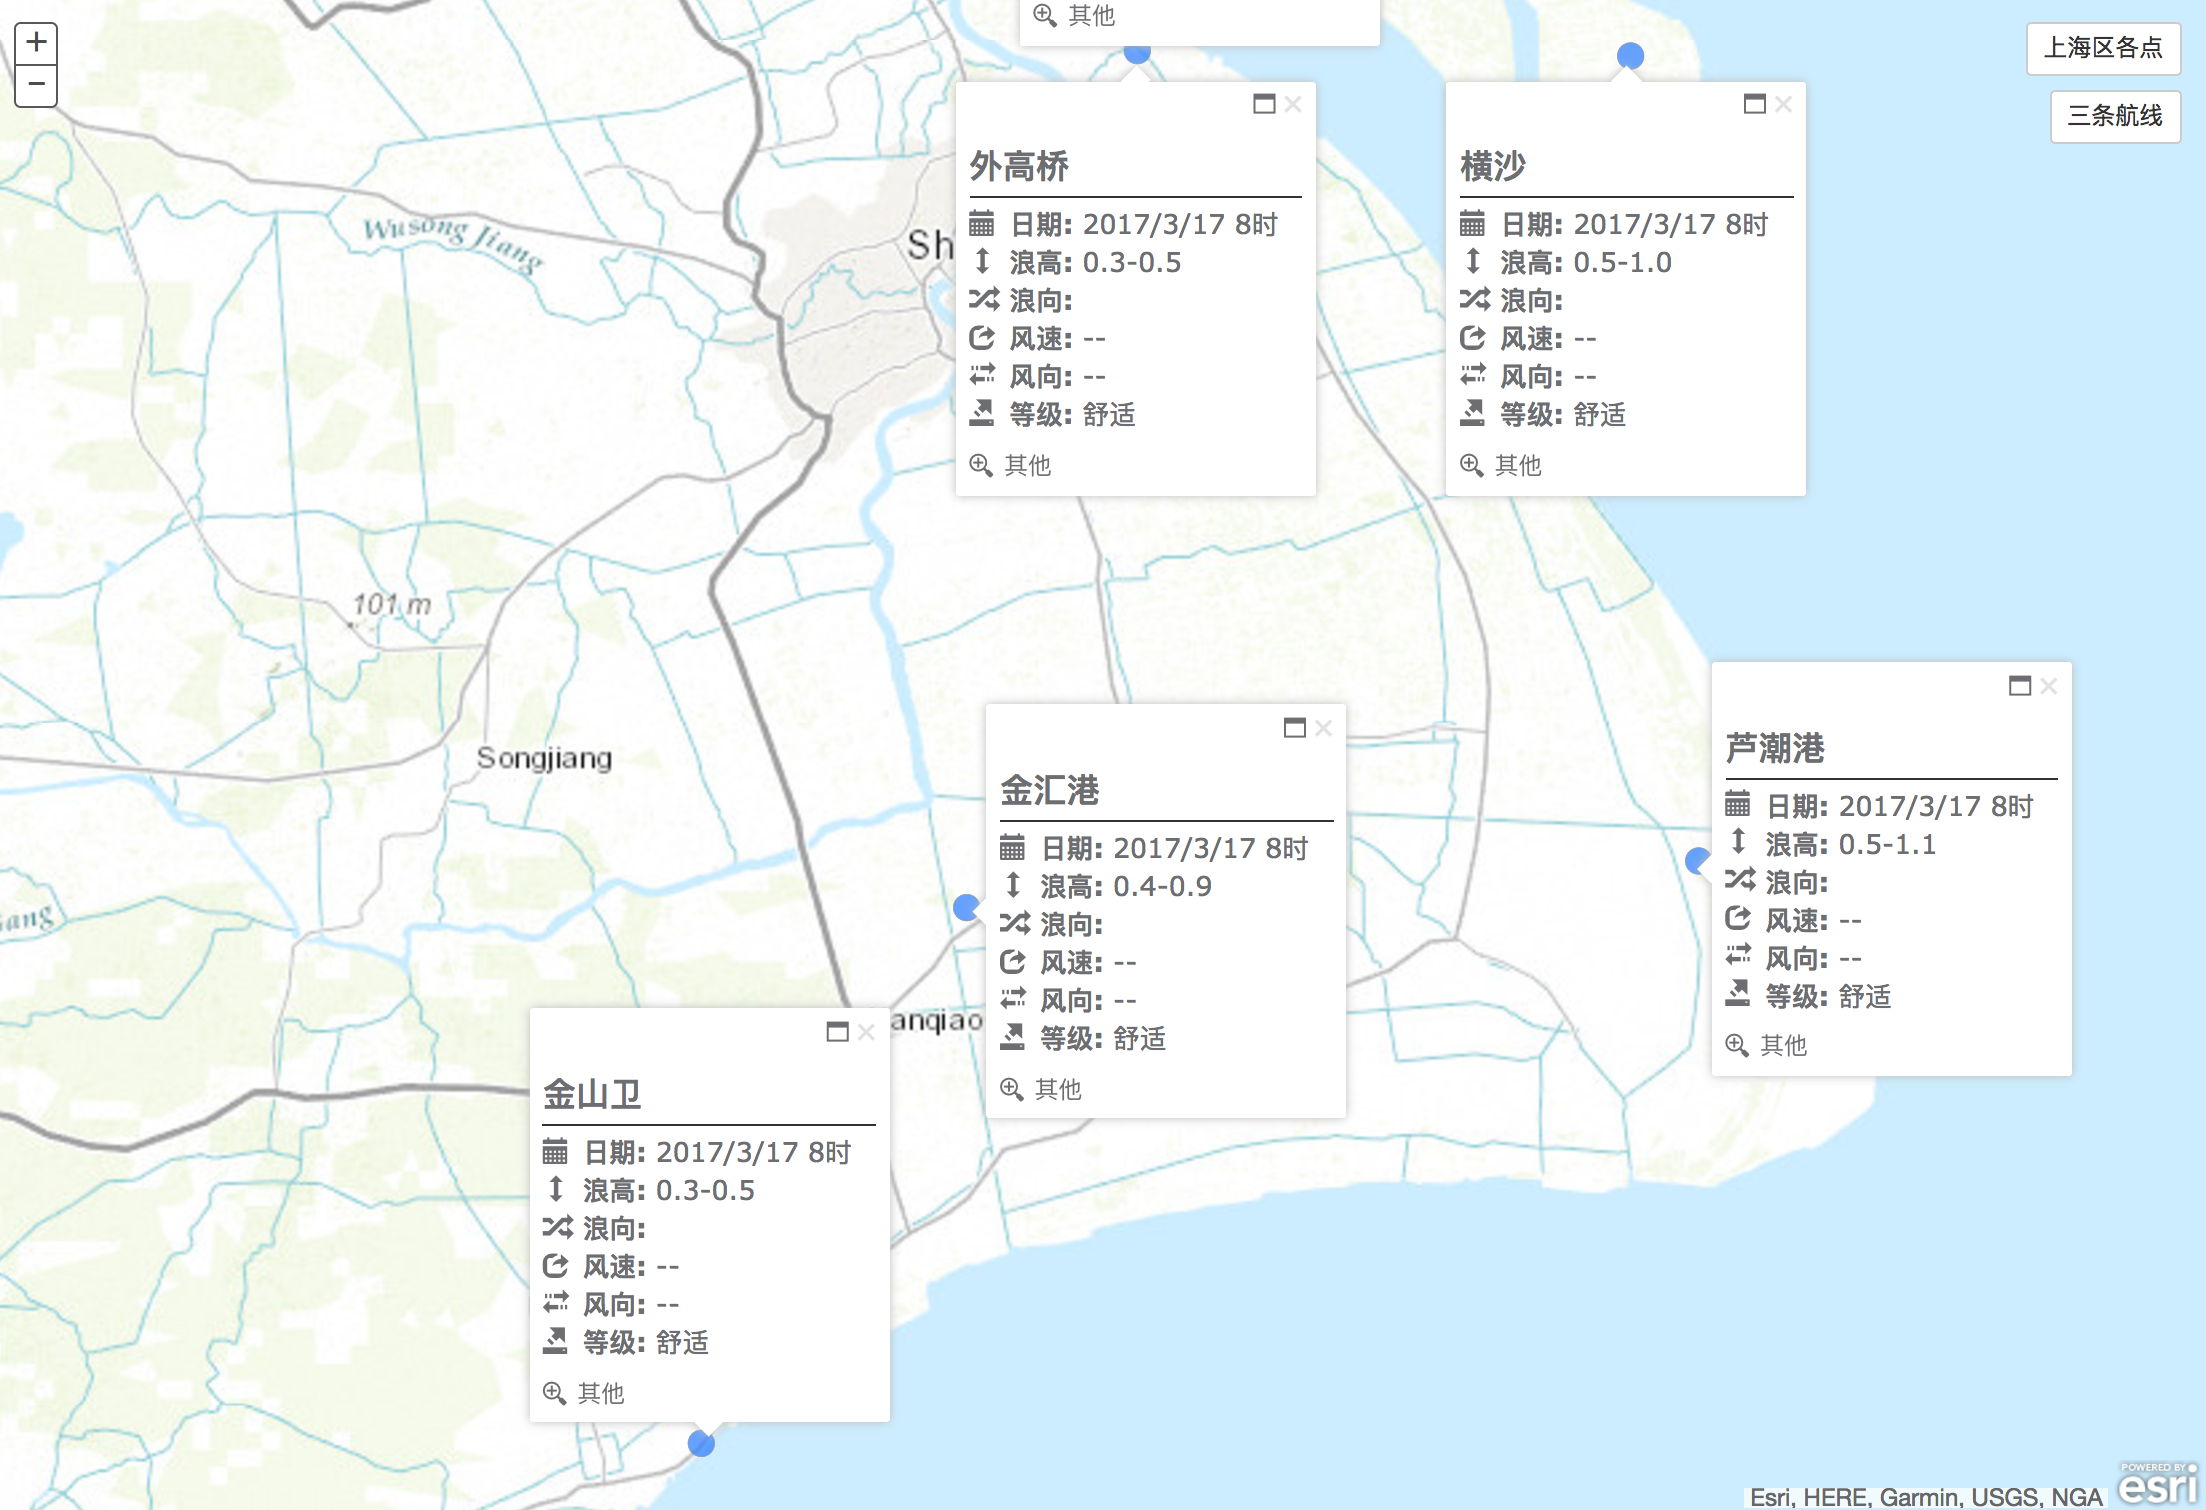
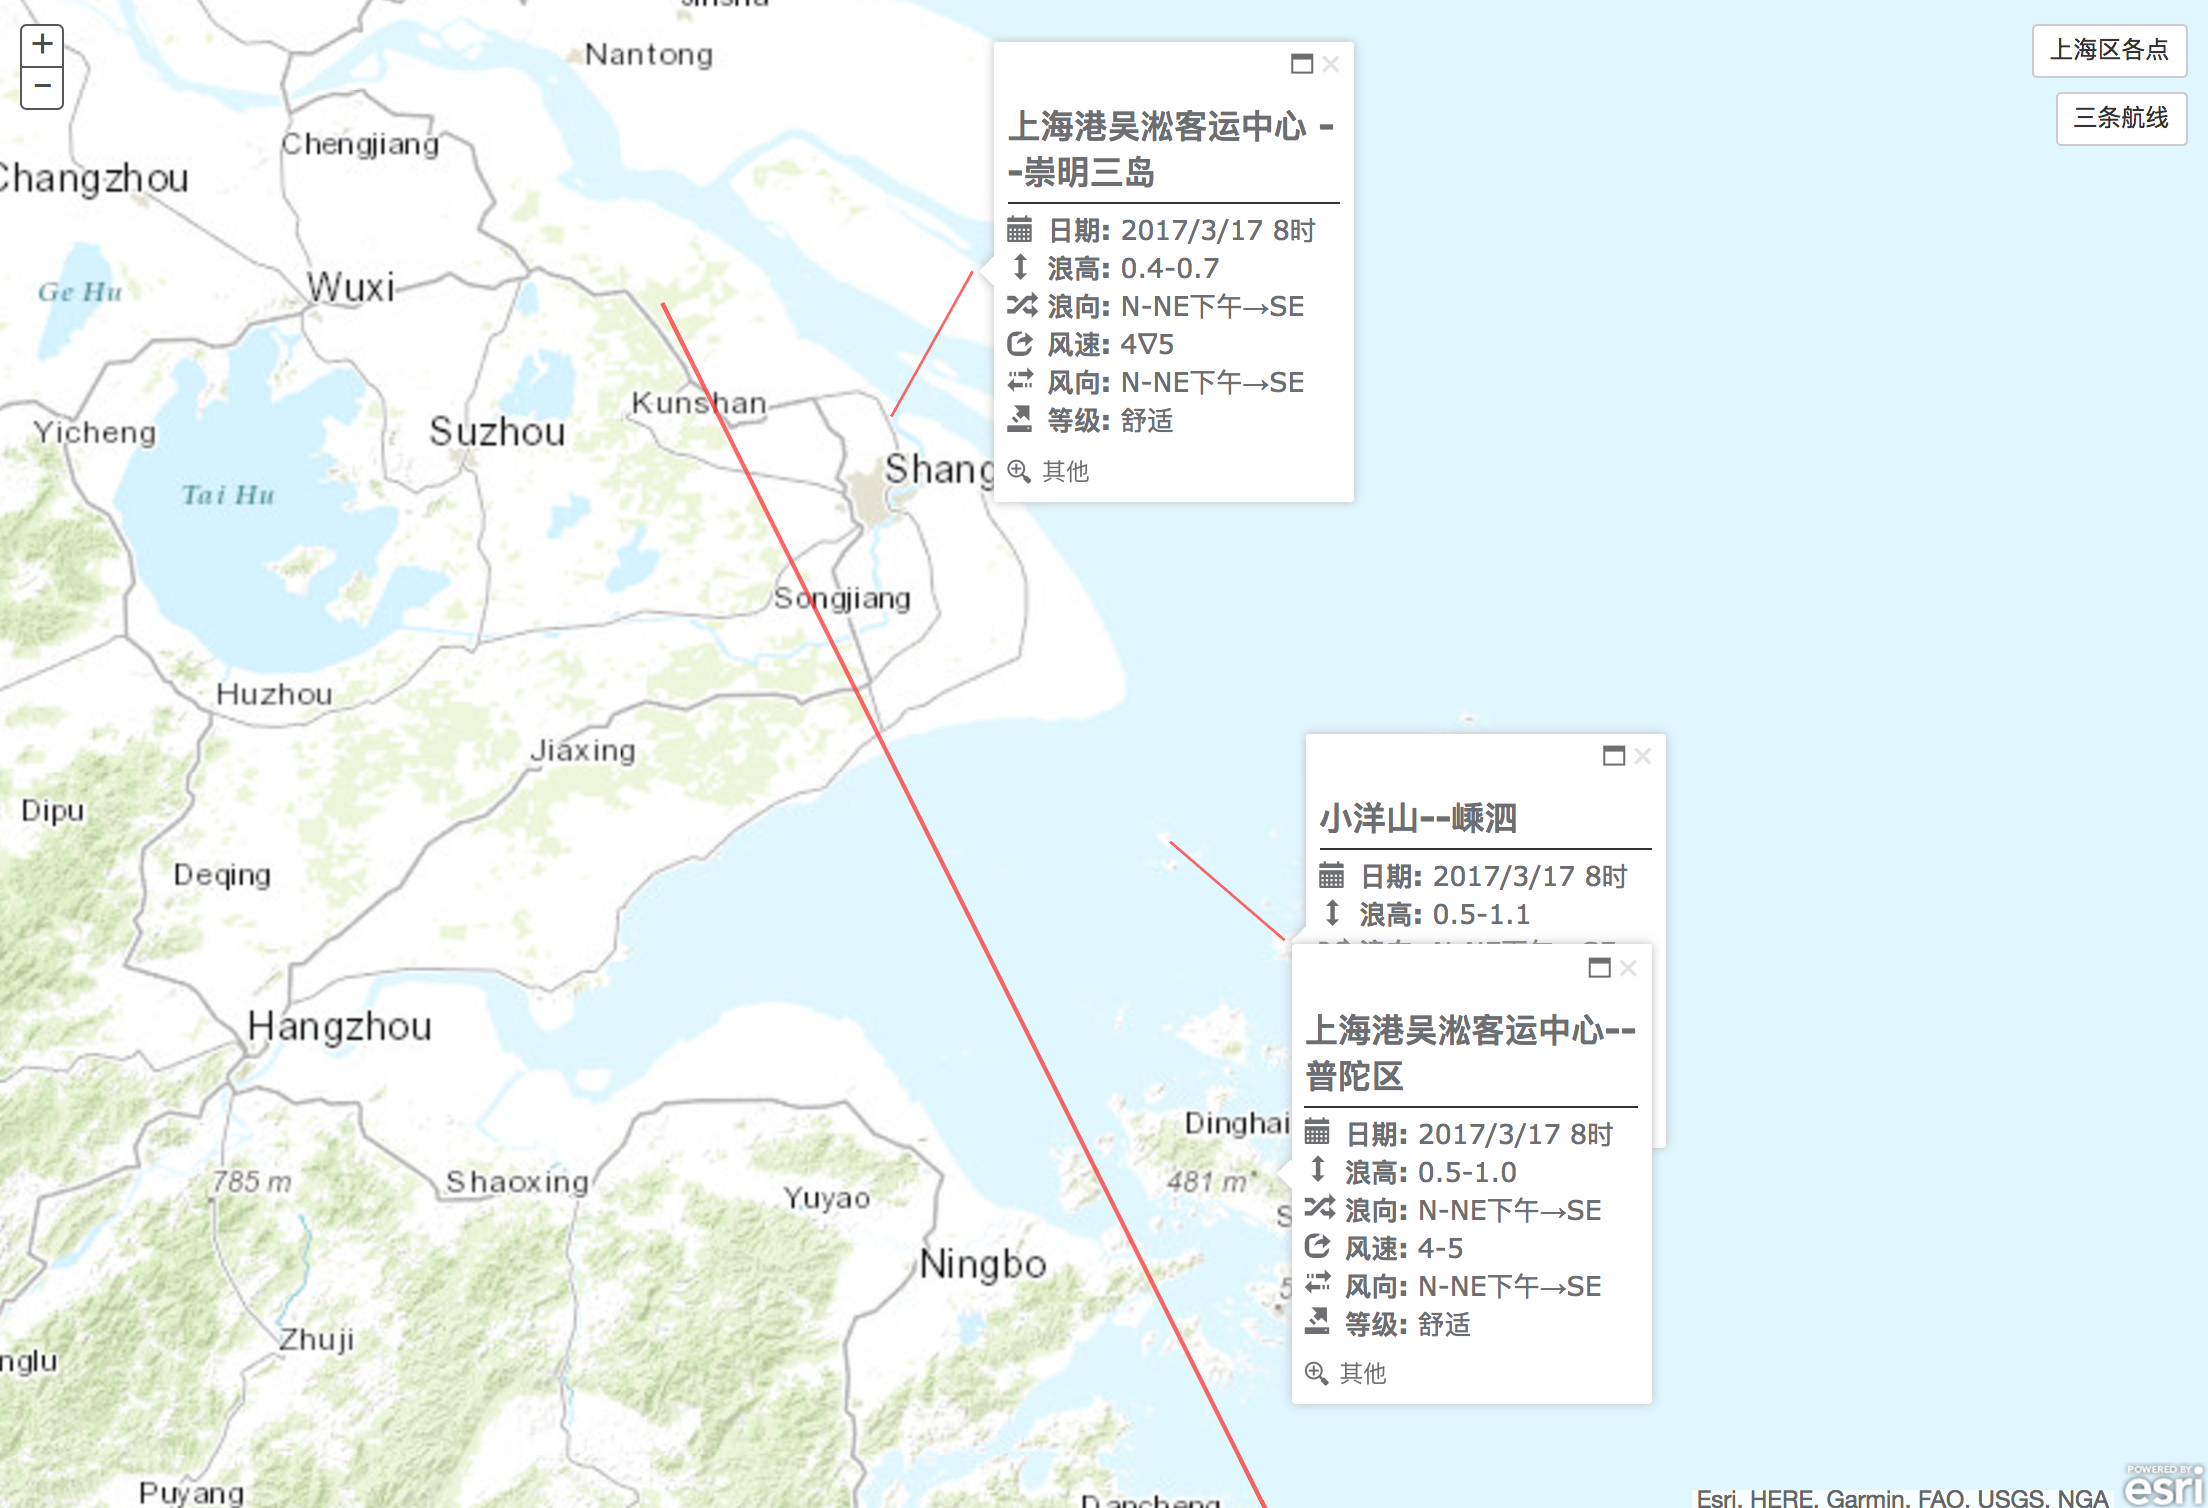
图1 上海5个地点的部分预报属性 图2 上海某三条航线的部分预报属性
2. 各类依赖库引入及前端HTML
首先需要先载入需要用的常用js、Arcgis及两个扩充库的js及部分css(下载地址见其github):

<!DOCTYPE html><html><head> <title>Add GeoJSON and Display Multiple Popup</title> <meta http-equiv="Content-Type" content="text/html; charset=utf-8"> <meta http-equiv="X-UA-Compatible" content="IE=7,IE=9"> <meta name="viewport" content="initial-scale=1, maximum-scale=1,user-scalable=no"> <!-- ArcGIS API for JavaScript CSS--> <link rel="stylesheet" href="http://js.arcgis.com/3.13/esri/css/esri.css"> <link rel="stylesheet" href="http://js.arcgis.com/3.13/dijit/themes/claro/claro.css"> <!-- Web Framework CSS - Bootstrap (getbootstrap.com) and Bootstrap-map-js (github.com/esri/bootstrap-map-js) --> <link rel="stylesheet" href="//netdna.bootstrapcdn.com/bootstrap/3.1.1/css/bootstrap.min.css" rel="stylesheet"> <link rel="stylesheet" href="./css/bootstrap.min.css"> <!-- PopExtendCss --> <link href="./vendor/ncam/PopupExtended.css" rel="stylesheet" /> <!-- PopupExtended references --> <script> var dojoConfig = { parseOnLoad: false, async: true, tlmSiblingOfDojo: false, packages: [{ name: "ncam", location: location.pathname.replace(/\/[^/]+$/, '') + "ncam" }] }; </script> <!-- ArcGIS API for JavaScript library references --> <script src="//js.arcgis.com/3.10"></script> <!-- Terraformer reference --> <script src="./vendor/terraformer/terraformer.min.js"></script> <script src="./vendor/terraformer-arcgis-parser/terraformer-arcgis-parser.min.js"></script> <!-- other reference --> <script src="./vendor/jquery.js"></script></head><body></body></html>
加入底图所需要的div与图层切换的Button:
<body> <div id="mapDiv"></div> <button type="line" id="shanghaiPoint" class="btn btn-default buttonRight" style="top:20px;right:20px">上海区各点</button> <button type="point" id="threeLine" class="btn btn-default buttonRight" style="top:70px;right:20px">三条航线</button></body>
3.置入Popupextended并扩充geojsonlayer.js
然后从geojsonlayer.js源码入手,开始将PopupExtended扩展其中,让我们新构建的geojsonlayer直接可拥有多个Popup。在geojsonlayer.js的constructor中很容易可以找出infotemplate的set方法:
// Default popup if (options.infoTemplate !== false) { this.setInfoTemplate(options.infoTemplate || new InfoTemplate("GeoJSON Data", "${*}")); }
很明显,geojsonlayer初始化时通过options传入参数进行判断并构造,所以实现本文目的的大致思路是将这里的setInfoTemplate替换成可以扩展的PopupExtended:
if (options.infoTemplate !== false) { //① create a PopupTemplate var template = new PopupTemplate({ title: "{name}", fieldInfos: [ { fieldName: "Id", label: "Id", visible: true }, { fieldName: "publishdate", label: "观测日期", visible: true }, { fieldName: "waveheight", label: "浪高", visible: true }, { fieldName: "wavedirection", label: "浪向", visible: true }, { fieldName: "windspeed", label: "风速", visible: true }, { fieldName: "winddirection", label: "风向", visible: true }, { fieldName: "comfort", label: "等级", visible: true } ], extended: { actions: [ { text: " IconText", className: "iconText", title: "Custom action with an icon and Text", click: function (feature) { alert("Icon Text clicked on " + "id: " + feature.attributes.id + " " + feature.attributes.name); } }, { text: "", className: "iconOnly", title: "Custom action only using an icon", click: function (feature) { alert("Icon action clicked on " + "id: " + feature.attributes.id + " " + feature.attributes.name); } } ], //uses a pretty bad custom theme defined in PopupExtended.css. scaleSelected: 1.6 } }); //② create a extend for basemap var extendedPopup = new PopupExtended({ extended: { themeClass: "light", draggable: true, defaultWidth: 250, actions: [{ text: "其他", className: "defaultAction", title: "Default action added in extendedPopup properties.", click: function (feature) { alert("clicked feature - " + feature.attributes); } }], hideOnOffClick: false, multiple: true, }, highlight: false, //titleInBody: false, }, dojo.create("div")); //③set the map to use the exteneded popup extendedPopup.setMap(options.baseMap); options.baseMap.infoWindow = extendedPopup; this.setInfoTemplate(options.infoTemplate || template); }
由上段代码可见,引入Popup给GeoJSON共分为三步:①实例化一个你需要的PopupTemplate(这里起名为template),可指定你需要展示的主题、数据项及扩展的一些交互action;②实例化一个PopupExtended并设置一些默认的Popup属性;③将实例化的PopupExtended——extendedPopup的Map设置为baseMap,并将baseMap的infowindow设置为extendedPopup,最后将geojsonlayer的infoTemplate设置为新构建的template。这样便可以实现对置入底图的geojsonlayer进行多个infoTemplate展示需求了。源代码见github:展示效果如图3:
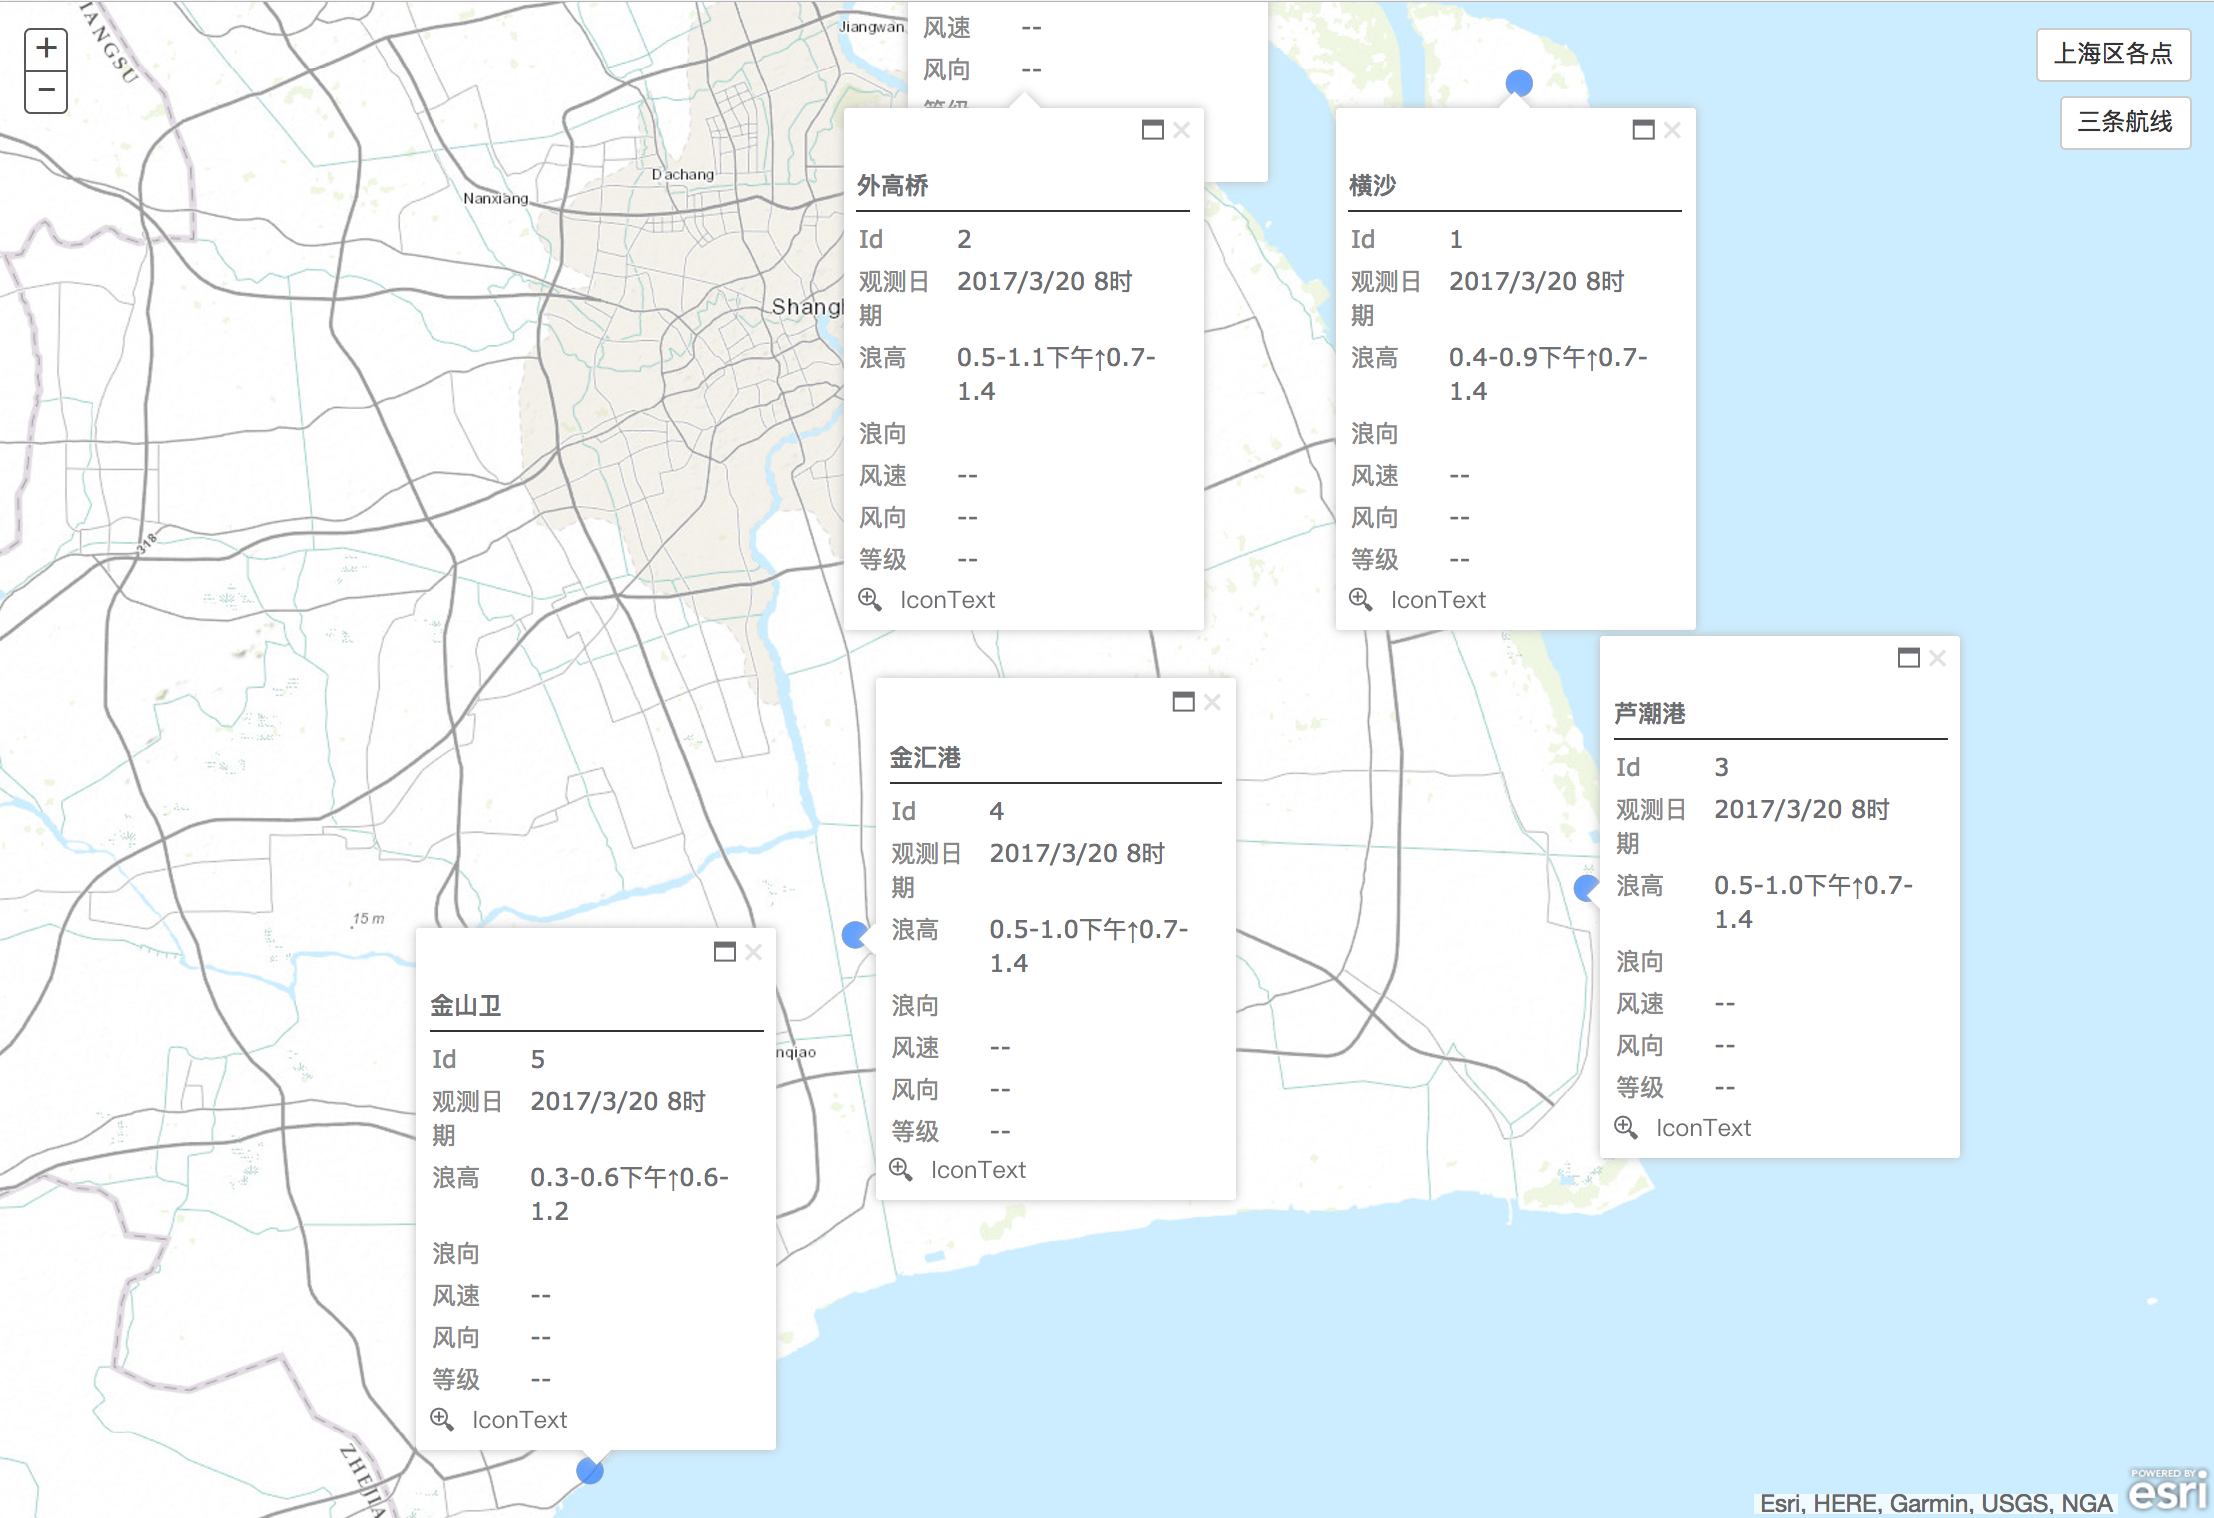
图3 对geojsonlayer扩充Popupextended后的显示效果
如若只需增加多个Popup至geojsonlayer的话,以上部分足以实现了。
4.增加新的Attributes及调整Popup的样式
由于设计上的需求,笔者需要从其他地址获取观测点的部分观测值,并且笔者的老师觉得应该加一些icon给属性,美化展示效果,所以需要重新构造两部分:①获取并为graphics增加新的attributes;②重构geojsonlayer的infoTemplate的content。
4.1 获取并为graphics增加新的attributes:
通过在button上利用fetch及Promise.all来同时获取6个点或3条航线的数据,并传入至初始化geojsonlayer的函数内;
$("#shanghaiPoint").click(function(){ // if first init geojsonlayer if(firstPointInit){ var requestBZ = 'http://wx.dhybzx.org:18080/forecast/shanghai_sea_env/80'; var requestWGQ = 'http://wx.dhybzx.org:18080/forecast/shanghai_sea_env/81'; var requestHS = 'http://wx.dhybzx.org:18080/forecast/shanghai_sea_env/82'; var requestLCG = 'http://wx.dhybzx.org:18080/forecast/shanghai_sea_env/83'; var requestJHG = 'http://wx.dhybzx.org:18080/forecast/shanghai_sea_env/84'; var requestJSW = 'http://wx.dhybzx.org:18080/forecast/shanghai_sea_env/85'; var urls = [requestBZ, requestWGQ,requestHS,requestLCG,requestJHG,requestJSW] Promise.all(urls.map(url => fetch(url).then(resp => resp.json()) )).then(results => { var tempJson = { "堡镇":results[0][0], "外高桥":results[1][0], "横沙":results[2][0], "芦潮港":results[3][0], "金汇港":results[4][0], "金山卫":results[5][0] } addGeoJsonToMap("./data/six_point.json",tempJson) }); }else{ //geojsonlayer has been initial addGeoJsonToMap("./data/six_point.json") } })这里的Promise.all采用了ES2015的箭头函数,兼容性问题需要自己考虑,也可以手动改成ES5支持的。将额外的attributes组装成tempJson后传入至初始化方法addGeoJsonToMap内。
4.2 重构geojsonlayer的infoTemplate的content:
在geojsonlayer.js内继续做一部分修改,注释掉实例化template中的fieldInfos属性及值,并且为geojsonlayer的infoTemplate设置新的content,代码如下:
var template = new PopupTemplate({ title: "{name}", // fieldInfos: [ // { fieldName: "Id", label: "Id", visible: true }, // { fieldName: "publishdate", label: "观测日期", visible: true }, // { fieldName: "waveheight", label: "浪高", visible: true }, // { fieldName: "wavedirection", label: "浪向", visible: true }, // { fieldName: "windspeed", label: "风速", visible: true }, // { fieldName: "winddirection", label: "风向", visible: true }, // { fieldName: "comfort", label: "等级", visible: true } // ], extended: { actions: [ { text: " IconText", className: "iconText", title: "Custom action with an icon and Text", click: function (feature) { alert("Icon Text clicked on " + "id: " + feature.attributes.id + " " + feature.attributes.name); } }, { text: "", className: "iconOnly", title: "Custom action only using an icon", click: function (feature) { alert("Icon action clicked on " + "id: " + feature.attributes.id + " " + feature.attributes.name); } } ], //uses a pretty bad custom theme defined in PopupExtended.css. scaleSelected: 1.6 } }); //create a extend for basemap var extendedPopup = new PopupExtended({ extended: { themeClass: "light", draggable: true, defaultWidth: 250, actions: [{ text: "其他", className: "defaultAction", title: "Default action added in extendedPopup properties.", click: function (feature) { alert("clicked feature - " + feature.attributes); } }], hideOnOffClick: false, multiple: true, }, highlight: false, //titleInBody: false, }, dojo.create("div")); //set the map to use the exteneded popup extendedPopup.setMap(options.baseMap); options.baseMap.infoWindow = extendedPopup; this.setInfoTemplate(options.infoTemplate || template); this.infoTemplate.setContent("<b class='popupTitle'>${name}</b>" + "<div class='hzLine'></div>"+ "<div class='popupContent'>"+ "<i class='glyphicon glyphicon-calendar'></i><b>日期: </b> ${publishdate}<br/>"+ "<i class='glyphicon glyphicon-resize-vertical'></i><b>浪高: </b> ${waveheight}<br/>" + "<i class='glyphicon glyphicon-random'></i><b>浪向: </b> ${wavedirection}<br/>"+ "<i class='glyphicon glyphicon-share'></i><b>风速: </b> ${windspeed}<br/>" + "<i class='glyphicon glyphicon-transfer'></i><b>风向: </b> ${winddirection}<br/>"+ "<i class='glyphicon glyphicon-export'></i><b>等级: </b> ${comfort}<br/>"+ "</div>" );
额外的属性和新的infoTemplate样式构造完成,但存在一个问题,即额外的attributes必须要在geojsonlayer绘制好后再进行设置并展示,arcgis提供了layer的layer-add及layer-add-result事件,但是无法监控到graphics是否已经增入至geojsonlayer内,所以必须要再做一些改进,使额外的属性能够在graphics绘制完毕后再添加进去。具体方法分为两步:1)初始化geojsonlayer时,将showAllPopup方法传入其构造函数内;2)在grahics添加至layer后,调用showAllPopup方法,显示所有的Popup。前端代码如下:
//add GeoJSON to baseMap , constuct show&hide popup method and add other attribute to graphics function addGeoJsonToMap(url,otherJson){ require(["esri/map", "./src/geojsonlayer.js", "esri/geometry/Point", "esri/SpatialReference", "dojo/on", "dojo/dom", "dojo/domReady!"], function (Map, GeoJsonLayer, Point, SpatialReference,on, dom) { var hasThisLayer=false; otherJson=otherJson?otherJson:""; hideAllPopup() //judge layer has been init map.getLayersVisibleAtScale().forEach(function(item){ if(item._url==url&&item.dataType=="geojson"){ console.log(item) item.show(); console.log("dd") showAllPopup(item); hasThisLayer=true; // map.setExtent(item.extent) }else if(item._url!=url&&item.dataType=="geojson"){ item.hide(); } }) if(!hasThisLayer){ addGeoJsonLayer(url); } //show all popups function showAllPopup(layer){ ...... } //hide all popups function hideAllPopup(){ ....... } //add other attribute to grpahics for popup function addAttrToGrpahics(item,type){ ....... } // Add the layer function addGeoJsonLayer(url) { // Create the layer var geoJsonLayer = new GeoJsonLayer({ baseMap:map, url: url, onLayerLoaded:function(layer){ showAllPopup(layer); } }); // Add to map geoJsonLayer.dataType="geojson"; map.addLayer(geoJsonLayer); } }); }
并且在geojsonlayer.js的constructor内加入:
this._onLayerLoaded = options.onLayerLoaded;在最后的_addGraphics方法中onLoad方法后,加入:
if (this._onLayerLoaded) this._onLayerLoaded(this);
利用show/hide方法,控制popup显示及隐藏。
//open all popuplayer.graphics.forEach(function(item){ if(firstPointInit&&otherJson[item.attributes.name]){ addAttrToGrpahics(item,layer.graphics[0].geometry.type) } var loc = map.toScreen(item.geometry); map.infoWindow.setFeatures([item]); map.infoWindow.show(loc);})//hide all popupvar tempLength = map.infoWindow.openPopups.length;for(var i=0;i<tempLength;i++){ map.infoWindow.openPopups[0].hide()}
5. 结论
至此,本文已经完成了在Arcgis for javascript API中实现Geojson的绘制,并同时展示其多个Popup的需求。最终的展示效果如图1、2。源代码见笔者的
- 利用Arcgis for javascript API绘制GeoJSON并同时弹出多个Popup
- ArcGIS API for Javascript 3.21地图开发实例(一、图形绘制和删除及popup弹出层)
- ArcGIS API for Javascript 第一个地图
- ArcGIS API for JavaScript——绘制工具(Draw)
- arcgis api for javascript 访问时弹出登录界面
- ArcGIS API for JavaScript
- arcgis for javascript 绘制多边形
- ArcGIS API for Silverlight 动态添加点的同时,添加文字说明(利用TextSymbol添加多文字信息 )
- ArcGIS API for Silverlight 动态添加点的同时,添加文字说明(利用TextSymbol添加多文字信息 )
- ArcGIS API for JavaScript之创建第一个应用
- 创建ArcGIS API for JavaScript的第一个示例程序
- ArcGIS API for JavaScript创建第一个程序
- 使用ArcGIS API for JavaScript创建第一个应用
- arcgis api for JavaScript相关
- arcgis api for JavaScript相关
- ArcGIS API for Javascript热区图
- ArcGIS API for Javascript介绍
- ArcGIS API for JavaScript是什么
- 在非Activity中请求危险权限
- 使用jQuery监听扫码枪输入并禁止手动输入的实现方法
- 蓝桥杯真题 ——地宫取宝(java)
- (转)CMD指令大全
- POJ2104K-th Number(主席树)
- 利用Arcgis for javascript API绘制GeoJSON并同时弹出多个Popup
- IDAPython类库---idautils.py的源码
- Eclipse显示目录层级结构
- 代码自动生成工具版本更新,新增支持Arduino uno R3
- APIJSON-以坚持和偏执,回敬傲慢和偏见
- Linux+Nginx+Asp.net Core及守护进程部署
- 微信API实例(OKHttp+PullToRefreshListView+WebView综合应用)
- Ant Colony Optimization
- struts2(二) 表单参数自动封装和参数类型自动转换