Python 显示图像的直方图
来源:互联网 发布:php面试编程题 编辑:程序博客网 时间:2024/05/29 12:16
http://www.cnblogs.com/denny402/p/5096790.html
http://blog.csdn.net/xiaowei_cqu/article/details/7600666
reshape和flatten函数
# -*- coding: utf-8 -*-"""Spyder EditorPython version 3.5This is a temporary script file."""from PIL import Imageimport numpy as npimport matplotlib.pyplot as pltvec=np.arange(15)print (vec)显示为[ 0 1 2 3 4 5 6 7 8 9 10 11 12 13 14]
如果我们要把这个一维数组,变成一个3*5二维矩阵,我们可以使用reshape来实现
# -*- coding: utf-8 -*-"""Spyder EditorPython version 3This is a temporary script file."""from PIL import Imageimport numpy as npimport matplotlib.pyplot as pltvec=np.arange(15)mat= vec.reshape(3,5)print (mat)[[ 0 1 2 3 4]
[ 5 6 7 8 9]
[10 11 12 13 14]]
现在如果我们返过来,知道一个二维矩阵,要变成一个一维数组,就不能用reshape了,只能用flatten. 我们来看两者的区别
a1=mat.reshape(1,-1) #-1表示为任意,让系统自动计算print (a1)a2=mat.flatten()print (a2)显示为
[[ 0 1 2 3 4 5 6 7 8 9 10 11 12 13 14]]
[ 0 1 2 3 4 5 6 7 8 9 10 11 12 13 14]
可以看出,用reshape进行变换,实际上变换后还是二维数组,两个方括号,因此只能用flatten.
我们要对图像求直方图,就需要先把图像矩阵进行flatten操作,使之变为一维数组,然后再进行统计。
一、画灰度图直方图
绘图都可以调用matplotlib.pyplot库来进行,其中的hist函数可以直接绘制直方图。
调用方式:
n, bins, patches = plt.hist(arr, bins=50, normed=1, facecolor='green', alpha=0.75)
n, bins, patches = plt.hist(arr, bins=50, normed=1, facecolor='green', alpha=0.75)
hist的参数非常多,但常用的就这五个,只有第一个是必须的,后面四个可选
arr: 需要计算直方图的一维数组
bins: 直方图的柱数,可选项,默认为10
normed: 是否将得到的直方图向量归一化。默认为0
facecolor: 直方图颜色
alpha: 透明度
返回值 :
n: 直方图向量,是否归一化由参数设定
bins: 返回各个bin的区间范围
patches: 返回每个bin里面包含的数据,是一个list
from PIL import Imageimport numpy as npimport matplotlib.pyplot as pltimg=np.array(Image.open('d:/pic/lena.jpg').convert('L'))plt.figure("lena")arr=img.flatten()n, bins, patches = plt.hist(arr, bins=256, normed=1, facecolor='green', alpha=0.75) plt.show()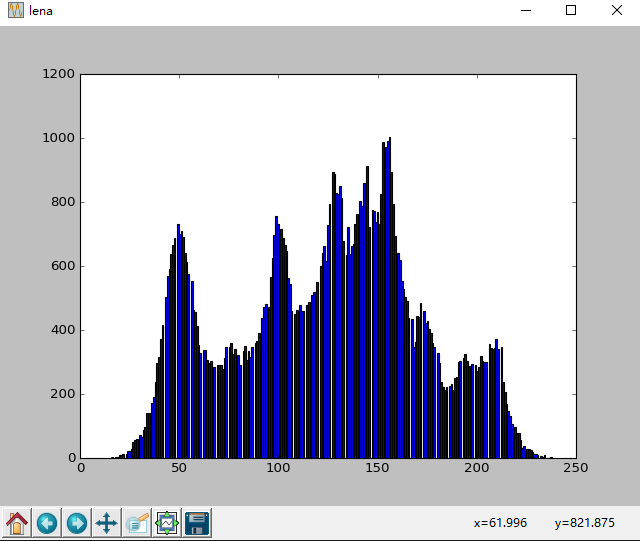
(用spyder没有这种效果,用ubuntu可以)

二、彩色图片直方图
实际上是和灰度直方图一样的,只是分别画出三通道的直方图,然后叠加在一起。
from PIL import Imageimport numpy as npimport matplotlib.pyplot as pltsrc=Image.open('d:/ex.jpg')r,g,b=src.split()plt.figure("lena")ar=np.array(r).flatten()plt.hist(ar, bins=256, normed=1,facecolor='r',edgecolor='r',hold=1)ag=np.array(g).flatten()plt.hist(ag, bins=256, normed=1, facecolor='g',edgecolor='g',hold=1)ab=np.array(b).flatten()plt.hist(ab, bins=256, normed=1, facecolor='b',edgecolor='b')plt.show()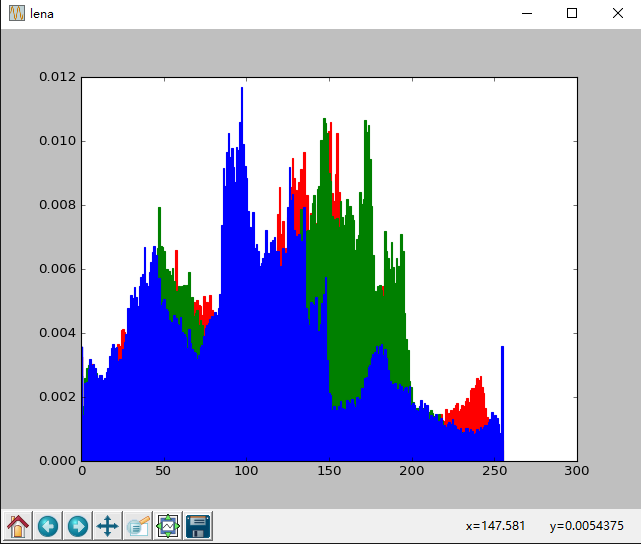
三 opencv画直方图
//绘制灰度直方图int main( ){Mat src,gray;src=imread("baboon.jpg");cvtColor(src,gray,CV_RGB2GRAY);int bins = 256;int hist_size[] = {bins};float range[] = { 0, 256 };const float* ranges[] = { range};MatND hist;int channels[] = {0};calcHist( &gray, 1, channels, Mat(), // do not use maskhist, 1, hist_size, ranges,true, // the histogram is uniformfalse );double max_val;minMaxLoc(hist, 0, &max_val, 0, 0);int scale = 2;int hist_height=256;Mat hist_img = Mat::zeros(hist_height,bins*scale, CV_8UC3);for(int i=0;i<bins;i++){float bin_val = hist.at<float>(i); int intensity = cvRound(bin_val*hist_height/max_val); //要绘制的高度rectangle(hist_img,Point(i*scale,hist_height-1),Point((i+1)*scale - 1, hist_height - intensity),CV_RGB(255,255,255));}imshow( "Source", src );imshow( "Gray Histogram", hist_img );waitKey(10000000000);return 0;}
绘制三维直方图
//绘制RGB三色分量直方图int main( ){Mat src;src=imread("baboon.jpg");int bins = 256;int hist_size[] = {bins};float range[] = { 0, 256 };const float* ranges[] = { range};MatND hist_r,hist_g,hist_b;int channels_r[] = {0};calcHist( &src, 1, channels_r, Mat(), // do not use maskhist_r, 1, hist_size, ranges,true, // the histogram is uniformfalse );int channels_g[] = {1};calcHist( &src, 1, channels_g, Mat(), // do not use maskhist_g, 1, hist_size, ranges,true, // the histogram is uniformfalse );int channels_b[] = {2};calcHist( &src, 1, channels_b, Mat(), // do not use maskhist_b, 1, hist_size, ranges,true, // the histogram is uniformfalse );double max_val_r,max_val_g,max_val_b;minMaxLoc(hist_r, 0, &max_val_r, 0, 0);minMaxLoc(hist_g, 0, &max_val_g, 0, 0);minMaxLoc(hist_b, 0, &max_val_b, 0, 0);int scale = 1;int hist_height=256;Mat hist_img = Mat::zeros(hist_height,bins*3, CV_8UC3);for(int i=0;i<bins;i++){float bin_val_r = hist_r.at<float>(i); float bin_val_g = hist_g.at<float>(i);float bin_val_b = hist_b.at<float>(i);int intensity_r = cvRound(bin_val_r*hist_height/max_val_r); //要绘制的高度int intensity_g = cvRound(bin_val_g*hist_height/max_val_g); //要绘制的高度int intensity_b = cvRound(bin_val_b*hist_height/max_val_b); //要绘制的高度rectangle(hist_img,Point(i*scale,hist_height-1),Point((i+1)*scale - 1, hist_height - intensity_r),CV_RGB(255,0,0));rectangle(hist_img,Point((i+bins)*scale,hist_height-1),Point((i+bins+1)*scale - 1, hist_height - intensity_g),CV_RGB(0,255,0));rectangle(hist_img,Point((i+bins*2)*scale,hist_height-1),Point((i+bins*2+1)*scale - 1, hist_height - intensity_b),CV_RGB(0,0,255));}imshow( "Source", src );imshow( "RGB Histogram", hist_img );waitKey(10000000000);return 0;}
//绘制H-S二维直方图int main( ){Mat src,hsv;src=imread("baboon.jpg");cvtColor(src, hsv, CV_BGR2HSV);// Quantize the hue to 30 levels// and the saturation to 32 levelsint hbins = 256, sbins = 180;int histSize[] = {hbins, sbins};// hue varies from 0 to 179, see cvtColorfloat hranges[] = { 0, 180 };// saturation varies from 0 (black-gray-white) to// 255 (pure spectrum color)float sranges[] = { 0, 256 };const float* ranges[] = { hranges, sranges };MatND hist;// we compute the histogram from the 0-th and 1-st channelsint channels[] = {0, 1};calcHist( &hsv, 1, channels, Mat(), // do not use maskhist, 2, histSize, ranges,true, // the histogram is uniformfalse );double maxVal=0;minMaxLoc(hist, 0, &maxVal, 0, 0);int scale = 2;Mat histImg = Mat::zeros(sbins*scale, hbins*scale, CV_8UC3);for( int h = 0; h < hbins; h++ )for( int s = 0; s < sbins; s++ ){float binVal = hist.at<float>(h, s);int intensity = cvRound(binVal*255/maxVal);rectangle( histImg, Point(h*scale, s*scale),Point( (h+1)*scale - 1, (s+1)*scale - 1),Scalar::all(intensity),CV_FILLED );}namedWindow( "Source", 1 );imshow( "Source", src );namedWindow( "H-S Histogram", 1 );imshow( "H-S Histogram", histImg );waitKey(10000000000);return 0;}
0 0
- Python 显示图像的直方图
- 图像的直方图显示与直方图均衡处理
- 显示一张图像的灰度直方图RGB
- OpenCV-007:图像直方图的显示
- 显示图像直方图
- python 图像直方图处理
- python opencv 显示直方图
- 彩色图像透明直方图显示
- 利用Python-caffe进行图像分类,卷积核的显示,激活值特征图的显示以及全连接层直方图显示
- Python编程-计算图像直方图
- opencv实现灰度图像的直方图点计算以及灰度直方图显示
- 彩色图像的直方图
- 图像的直方图matlab
- 灰度图像的直方图
- 图像的直方图
- [图像] 直方图的距离
- 图像直方图的应用
- 灰度图像的直方图
- 使用NSURLSession简单做一个上传图片的方法
- 验证框架
- 接口测试学习大总结【持续更新ing】
- windows和linux路径斜杠不兼容问题
- 笔记3-JAVA的初学浅识(基础)
- Python 显示图像的直方图
- 字节序
- CentOS6.8重新安装yum
- CodeForces 639 B.Bear and Forgotten Tree 3(构造)
- python例子
- android 状态栏只显示电量时间
- ubuntu下tensorflow的环境搭建
- Docker 组件如何协作?- 每天5分钟玩转容器技术(8)
- 网络习题汇总