Moving Averages(3): How To Use Them
来源:互联网 发布:淘宝代做课程设计 编辑:程序博客网 时间:2024/06/05 11:59
明天高考。祝所有努力的孩子都有好结果,祝所有临阵磨枪,想去撞大运的娃儿,都死得很难看!
然而我是一个努力又死得很惨的苦命运动员……
从明天开始,开发一个小项目。
今天继续翻译一篇。
By Casey Murphy, Senior Analyst ChartAdvisor.com
Some of the primary functions of a moving average are to identify trends and reversals, measure the strength of an asset's momentum and determine potential areas where an asset will find support or resistance. In this section we will point out how different time periods can monitor momentum and how moving averages can be beneficial in setting stop-losses. Furthermore, we will address some of the capabilities and limitations of moving averages that one should consider when using them as part of a trading routine.
滑动平均(MA)的主要功能是识别出趋势、反转,度量资产的量能,可能还可以决定资产价值的支撑位和阻力位。
本节我们将学习不同窗口长度的均线是怎么监视量能的,以及,在设置止损线的时候,MA是怎样让我们获益的。
此外,我们还要强调在真正的交易的时候,大家应该考虑到的MA的性能和局限。
Trend
Identifying trends is one of the key functions of moving averages, which are used by most traders who seek to "make the trend their friend". Moving averages are lagging indicators, which means that they do not predict new trends, but confirm trends once they have been established. As you can see in Figure 1, a stock is deemed to be in an uptrend when the price is above a moving average and the average is sloping upward. Conversely, a trader will use a price below a downward sloping average to confirm a downtrend. Many traders will only consider holding a long position in an asset when the price is trading above a moving average. This simple rule can help ensure that the trend works in the traders' favor.
MA的主要功能是识别出趋势。但MA是一种滞后的指标,并不能预测一个新的趋势(要是真的能预测了,那稳赚),但它可以确定出已经建立出来的趋势。换句话说,必要条件,而非充分条件。图1中,当股价在均线之上、均线向上倾斜的时候,我们可以认为这只股票正处于一种上升的趋势。一般情况下,多头即可买买买。
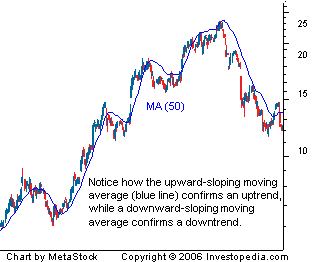 Figure 1
Momentum
Many beginner traders ask how it is possible to measure momentum and how moving averages can be used to tackle such a feat. The simple answer is to pay close attention to the time periods used in creating the average, as each time period can provide valuable insight into different types of momentum. In general, short-term momentum can be gauged by looking at moving averages that focus on time periods of 20 days or less. Looking at moving averages that are created with a period of 20 to 100 days is generally regarded as a good measure of medium-term momentum. Finally, any moving average that uses 100 days or more in the calculation can be used as a measure of long-term momentum. Common sense should tell you that a 15-day moving average is a more appropriate measure of short-term momentum than a 200-day moving average.
MA可以度量动量(居然也用动量这个词。p = mv...)。不同窗口长度的MA,不同周期的均线,可以针对不同类型的动能提供一些有价值的参考意见。通常,20日(不一定是日,某一个时间长度T即可)甚至更短的均线可以测量出短期动量。20-100日均线通常可以测量中期动能,大于等于100天均线则可以度量长期动量。要看什么,就针对性地选不同时间长度的均线。
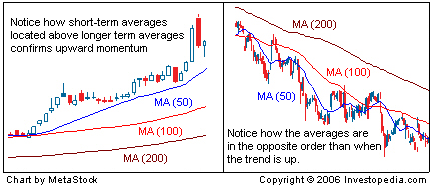 Figure 2
一种非常好的确定(评估)一项资产的动量的强度和方向的方法是,观察图上三条不同周期的均线的关系。三条均线,分别代表短期、中期和长期的价格特征。在图2中,价格迅速上涨,短期均线快速上扬,短期均线和长期均线之间的距离越来越大(发散),这代表着非常强的上涨的动量。相反,如果快速均线迅速下跌,快线和慢线也逐渐发散,说明动量是一种强势的下跌状态。
Support
Another common use of moving averages is in determining potential price supports. It does not take much experience in dealing with moving averages to notice that the falling price of an asset will often stop and reverse direction at the same level as an important average. For example, in Figure 3 you can see that the 200-day moving average was able to prop up the price of the stock after it fell from its high near $32. Many traders will anticipate a bounce off of major moving averages and will use other technical indicators as confirmation of the expected move.
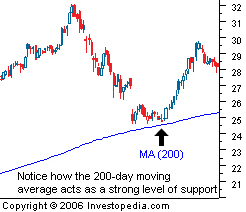 Figure 3均线另一个常见的用法是确定潜在的支撑位。非常重要的均线可能是一种强有力的支撑。比如30日均线,60日,100日,200日,半年线,年线……这些恐怕是心理暗示……“抄底摸顶”的“抄底”可能就是这个意思。
均线方向朝上,股价下跌,跌到MA200附近,这是个支撑位,很有可能会反弹。
Once the price of an asset falls below an influential level of support, such as the 200-day moving average, it is not uncommon to see the average act as a strong barrier that prevents investors from pushing the price back above that average. As you can see from the chart below, this resistance is often used by traders as a sign to take profits or to close out any existing long positions. Many short sellers will also use these averages as entry points because the price often bounces off the resistance and continues its move lower. If you are an investor who is holding a long position in an asset that is trading below major moving averages, it may be in your best interest to watch these levels closely because they can greatly affect the value of your investment.
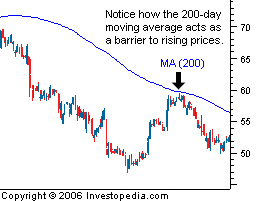 Figure 4
股价下降,均线下降,趋势很糟糕。尽管中间反弹了一段,但这条下降的MA200均线仍然是一个重要的阻力位。上不去啊!没有突破阻力位,是不是就该“摸顶”了。此时应该的动作:卖出平仓、多头止损或止盈,卖出开仓,开始空头。
The support and resistance characteristics of moving averages make them a great tool for managing risk. The ability of moving averages to identify strategic places to set stop-loss orders allows traders to cut off losing positions before they can grow any larger. As you can see in Figure 5, traders who hold a long position in a stock and set their stop-loss orders below influential averages can save themselves a lot of money. Using moving averages to set stop-loss orders is key to any successful trading strategy.
MA的阻力位和支撑位的特性让MA成为了一种非常好的风险管理的工具。
如图5,在这里的MA200下方一点设置止损,将会躲过一场浩劫!(跌破支撑位了啊!)
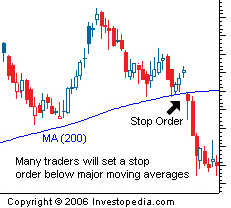 Figure 5
- Moving Averages(3): How To Use Them
- Moving Averages(4): Factors To Consider
- Moving Averages(1): Introduction
- Moving Averages(5): Strategies
- Moving Averages(7):Conclusions
- Moving Averages(2): What Are They?
- Moving Averages(6):Different Flavors
- trend anlysis--Moving Averages
- Why Prepared Statements are important and how to use them "properly"
- Xcode 6 allows VECTOR image assets… any idea how to use them?
- Four Logical Relationships of Project Management: What They Are and How To Use Them
- how to use php framework(1)
- How To Use DataGird
- how to use typedef
- how to use gz
- How to use chkconfig
- How to use ,,,,
- how to use dialog
- 整数排序
- 编辑神器 Emmet
- SPPNet:Spatial Pyramid Pooling in Deep Convolutional Networks for Visual Recognition
- 2017上海金马五校程序设计竞赛 B:Sailing
- Axure的使用---原型图
- Moving Averages(3): How To Use Them
- C笔记 动态分配 malloc,free,calloc,realloc
- 有趣的汉语:同音文(二):《施氏食狮史》
- 2017 -金马五校程序设计竞赛-A
- 第一次使用Bootstrap
- CentOS、Ubuntu、Debian三个linux比较异同
- Linux进程池与线程池以及线程池的简单实现
- python基础学习之——格式化%——printf(“*%06d*\n”,x);是什么意思?
- Mac 添加用户级变量


