特征选择与评分的可视化显示
来源:互联网 发布:淘宝店更换类目影响 编辑:程序博客网 时间:2024/06/04 00:18
特征选择的一种常用方法是计算各个特征与标签的相关性,给特征打分,根据分值大小排序进行选择。例如:scikit-learn中的SelectKBest和SelectPercentile默认的"f_classif"就是通过方差分析给特征打分。我们常常会直接使用 SelectKBest 进行特征选择,但有的时候,我们希望了解各类特征的价值,从而指导我们可以进一步致力于挖掘数据哪方面的特征。这时候将特征的评分可视化一下看起来就会非常方便。
这里以鸢尾花数据集为例,使用“横着的”条形图进行特征可视化(当然竖着的也行哈)

这里以鸢尾花数据集为例,使用“横着的”条形图进行特征可视化(当然竖着的也行哈)
一、简单的可视化函数:
import numpy as npfrom sklearn.feature_selection import SelectKBestfrom matplotlib import pyplot as pltdef plot_feature_scores(x, y, names=None): if not names: names = range(len(x[0])) # 1. 使用 sklearn.feature_selection.SelectKBest 给特征打分 slct = SelectKBest(k="all") slct.fit(x, y) scores = slct.scores_ # 2. 将特征按分数 从大到小 排序 named_scores = zip(names, scores) sorted_named_scores = sorted(named_scores, key=lambda z: z[1], reverse=True) sorted_scores = [each[1] for each in sorted_named_scores] sorted_names = [each[0] for each in sorted_named_scores] y_pos = np.arange(len(names)) # 从上而下的绘图顺序 # 3. 绘图 fig, ax = plt.subplots() ax.barh(y_pos, sorted_scores, height=0.7, align='center', color='#AAAAAA', tick_label=sorted_names) # ax.set_yticklabels(sorted_names) # 也可以在这里设置 条条 的标签~ ax.set_yticks(y_pos) ax.set_xlabel('Feature Score') ax.set_ylabel('Feature Name') ax.invert_yaxis() ax.set_title('F_classif scores of the features.') # 4. 添加每个 条条 的数字标签 for score, pos in zip(sorted_scores, y_pos): ax.text(score + 20, pos, '%.1f' % score, ha='center', va='bottom', fontsize=8) plt.show()该函数的输入是 特征向量list、标签list 和 特征名称list,不输入特征名称时默认按特征向量的下标显示。
二、载入鸢尾花数据集,并手动输入特征名称
from sklearn import datasetsdef load_named_x_y_data(): """ 载入数据,同时也返回特征的名称,以便可视化显示(以鸢尾花数据集为例) """ # x_names = ["花萼长度", "花萼宽度", "花瓣长度", "花瓣宽度"] x_names = ["sepal_lenth", "sepal_width", "petal_lenth", "petal_width"] iris = datasets.load_iris() x = iris.data y = iris.target return x, y, x_names
def main(): x, y, names = load_named_x_y_data() plot_feature_scores(x, y, names) returnif __name__ == "__main__": main()
计算结果显示“花瓣长度”特征最为重要,“花瓣宽度”特征也很重要。而花萼的两个特征重要性却相当低。
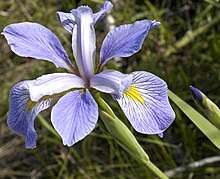
我们可以简单看一下该数据集包含的三类鸢尾花都长啥样~
1.山鸢尾(setosa)

2.杂色鸢尾(Versicolour)

3.维吉尼亚鸢尾(Virginica)
好像也看不出来什么~~23333~
四、最后附上完整代码:
# coding:utf-8from sklearn import datasetsimport numpy as npfrom sklearn.feature_selection import SelectKBestfrom matplotlib import pyplot as pltdef load_named_x_y_data(): """ 载入数据,同时也返回特征的名称,以便可视化显示(以鸢尾花数据集为例) """ # x_names = ["花萼长度", "花萼宽度", "花瓣长度", "花瓣宽度"] x_names = ["sepal_lenth", "sepal_width", "petal_lenth", "petal_width"] iris = datasets.load_iris() x = iris.data y = iris.target return x, y, x_namesdef plot_feature_scores(x, y, names=None): if not names: names = range(len(x[0])) # 1. 使用 sklearn.feature_selection.SelectKBest 给特征打分 slct = SelectKBest(k="all") slct.fit(x, y) scores = slct.scores_ # 2. 将特征按分数 从大到小 排序 named_scores = zip(names, scores) sorted_named_scores = sorted(named_scores, key=lambda z: z[1], reverse=True) sorted_scores = [each[1] for each in sorted_named_scores] sorted_names = [each[0] for each in sorted_named_scores] y_pos = np.arange(len(names)) # 从上而下的绘图顺序 # 3. 绘图 fig, ax = plt.subplots() ax.barh(y_pos, sorted_scores, height=0.7, align='center', color='#AAAAAA', tick_label=sorted_names) # ax.set_yticklabels(sorted_names) # 也可以在这里设置 条条 的标签~ ax.set_yticks(y_pos) ax.set_xlabel('Feature Score') ax.set_ylabel('Feature Name') ax.invert_yaxis() ax.set_title('F_classif scores of the features.') # 4. 添加每个 条条 的数字标签 for score, pos in zip(sorted_scores, y_pos): ax.text(score + 20, pos, '%.1f' % score, ha='center', va='bottom', fontsize=8) plt.show()def main(): x, y, names = load_named_x_y_data() plot_feature_scores(x, y, names) returnif __name__ == "__main__": main()鸢尾花数据集只有4个特征,可能直接 print 特征得分就可以看出来哪个重要、哪个不重要了,但是实际情况下很多时候(比如一些数据挖掘竞赛),一脸懵逼的你很可能会先二话不说狂写一两百个特征,这个时候绘图就比较重要了~

只显示排名前三十的特征,瞬间就清爽了许多(需要看其他的特征的话,也可以分段绘图)~

阅读全文
0 0
- 特征选择与评分的可视化显示
- 特征选择与特征抽取的区别
- HOG特征显示 可视化HOG
- HOG特征的可视化
- 特征选择与特征提取
- 特征选择与特征抽取
- 特征抽取与特征选择
- 特征选择与特征学习
- 特征选择与特征学习
- 特征选择与特征提取
- 特征抽取与特征选择
- 特征选择与特征学习
- 特征提取与特征选择
- 特征选择与特征学习
- 特征处理与特征选择
- 特征提取与特征选择
- 特征选择与特征权重计算的区别
- 特征选择与特征权重计算的区别
- 线程安全与可重入函数的对比
- 数论与积性函数
- 学习笔记之Tensorflow Line Model Tutorial (tf.learn人口普查二分类)
- 1.计算机概述
- memmove 函数
- 特征选择与评分的可视化显示
- Centos 7 中部署ASP.NET Core网站问题记录
- Linuxc语言复习篇指针(-)
- Maven的Tomcat插件的使用
- LintCoder python 小白2-骰子求和
- PagerSlidingTabStrip源码分析
- 带Attention机制的Seq2Seq框架梳理
- 石子归并问题
- 直方图最大矩形面积--c/c++