echarts折线图柱状图的坐标轴的颜色及样式的设置
来源:互联网 发布:保留数据重置win10 编辑:程序博客网 时间:2024/05/16 14:10
转载网址见:
http://www.cnblogs.com/my-freedom/p/6699271.html
基本用法请查看echarts官网。
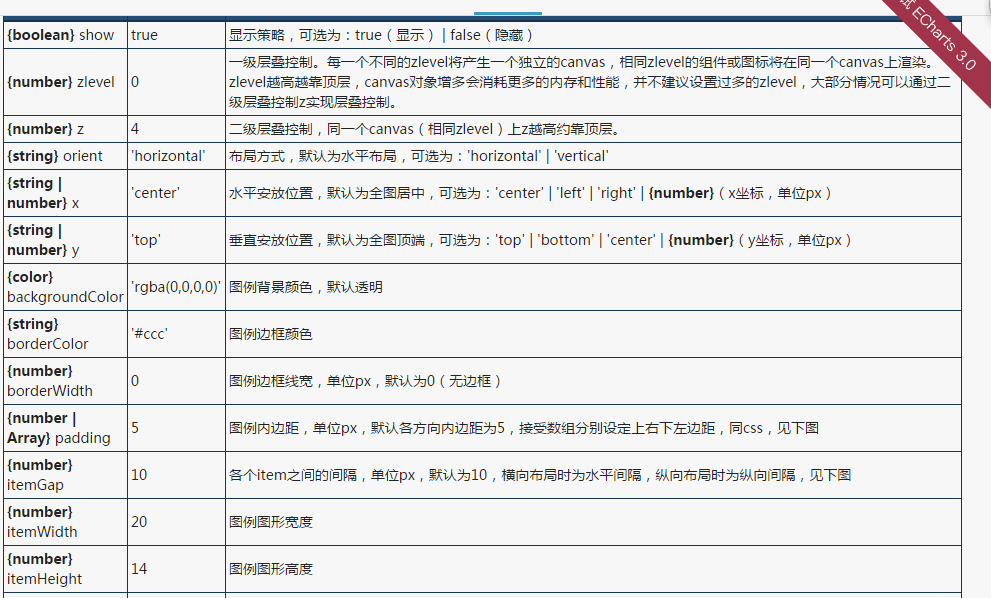
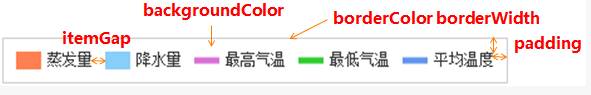
一、图例legend的设置。
1.字体和颜色的设置
1
2
3
4
textStyle:{ fontSize:15, color:'#fff' }2.样式的设置
1
2
3
4
5
6
7
8
9
legend: { data:systemName, itemWidth:40, itemHeight:20, textStyle:{ fontSize:15, color:'#fff' } }可以根据需求自己设置。
二、工具箱toolbox的设置

三、tooltip悬浮提示框
1
2
3
4
5
6
7
8
9
10
11
{ type: 'line', lineStyle: { color: '#48b', width: 2, type: 'solid' }, textStyle:{ color:'#fff' }}三、x轴坐标xAxis的字体颜色大小,坐标线颜色,以及网格线的设置
1
2
3
4
5
6
7
8
9
10
11
12
13
14
15
16
17
18
19
20
21
22
xAxis : [ { type: 'category', boundaryGap: false, data: time, splitLine:{show: false},//去除网格线 splitArea : {show : true},//保留网格区域 axisLine: { lineStyle: { type: 'solid', color: '#fff',//左边线的颜色 width:'2'//坐标线的宽度 } }, axisLabel: { textStyle: { color: '#fff',//坐标值得具体的颜色 } } } ]四、yAsix的设置相同
1
2
3
4
5
6
7
8
9
10
11
12
13
14
15
16
17
18
19
yAxis : [ { type : 'value', splitLine:{show: false},//去除网格线 splitArea : {show : true},//保留网格区域 axisLine: { lineStyle: { type: 'solid', color:'#fff', width:'2' } }, axisLabel: { textStyle: { color: '#fff' } } } ]阅读全文
0 0
- echarts折线图柱状图的坐标轴的颜色及样式的设置
- 为echarts的叠加柱状图设置颜色
- echarts设置折线拐点中心的颜色
- echarts 柱状图坐标轴颜色
- echarts 好看的柱状图样式
- ECHARTS的基本使用:柱状图、折线图、饼图等
- Echarts 绘制简单的图表柱状图、折线图
- Echarts柱状图与折线图的基本使用
- ECharts柱状图/折线图点击图例无法增添/删除折线的问题解决
- echarts改变柱状图每个柱子的颜色
- echarts折线图的数据视图样式重写
- echarts-设置折线样式和X轴和Y轴的分割线样式
- echarts-设置折线样式和X轴和Y轴的分割线样式
- echarts-设置折线样式和X轴和Y轴的分割线样式
- 仿echarts的折线图
- Echarts折线图的实例
- echarts 插件开发柱状图、折线图、饼状图(具有详细的注释)
- echarts折线图实线与虚线拼接,及提示框浮层内容格式的设置
- has_many through(多对多) 与polymorphic(多态)混合使用
- php 接口与前端数据交互实现
- 【剑指offer】面试题10:斐波那契数列
- AAC-封装格式
- python 高级特性
- echarts折线图柱状图的坐标轴的颜色及样式的设置
- Python编程_Lesson005_元组
- jupyter notebook 要点
- 敲黑板!break和continue的区别!
- tftp下载及协议
- Eclipse转IDEA及快捷键、常用优化设置
- Vue computed计算属性的妙用
- 自定义DrawableTextView——实现TextView左上右下的点击监听
- echarts 柱状图 ,颜色和显示设置