Intelligence Math Part2
来源:互联网 发布:大数据 adhoc 编辑:程序博客网 时间:2024/06/05 14:39
Part2 SVM
What will we do?
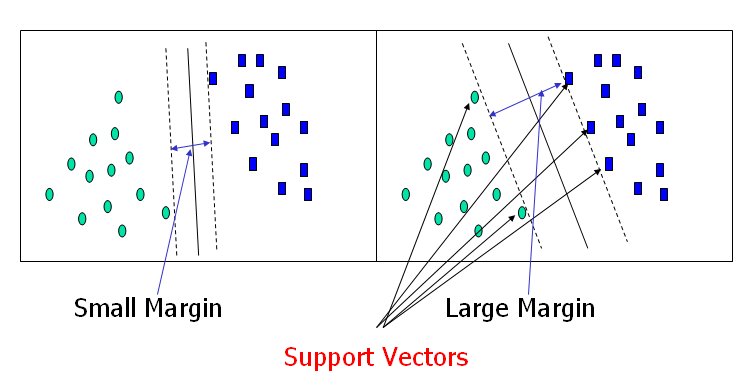
我们将构建一个支持向量机(Support Vector Machine),通过梯度下降优化算法找到能够最大间隔化两类数据的最优超平面(最大间隔分类器)
What are some use cases for SVMs?
-分类,回归(时序序列预测等), 异常检测, 聚类等
Other Examples
- Learning to use Scikit-learn’s SVM function to classify images https://github.com/ksopyla/svm_mnist_digit_classification
- Pulse classification, more useful dataset
https://github.com/akasantony/pulse-classification-svm
How does an SVM compare to other ML algorithms?

- 以经验来看, 对于含有较少异常值的小数据量,SVMs更加适合。
- 其它算法(Random forests, deep neural networks, etc.)需要更多的数据,但是训练出的模型鲁棒性都较好。
- 选择什么样的分类器取决于数据集以及该问题的复杂度。
- 如果选择一个复杂的模型(比如neural networks), performance相对于简单的model仅仅提高了 0.1(or small),那么还是选简单的比较好(时间还是很重要的)。
What is a Support Vector Machine?
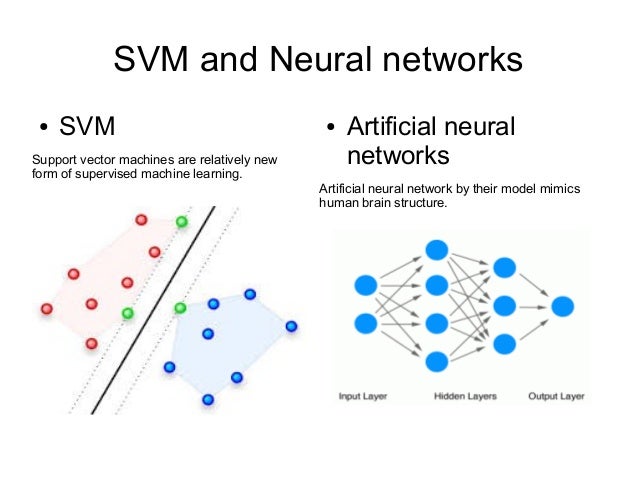
SVM 是一个监督学习式的机器学习算法,既适用于分类问题,也适用于回归问题。但是通常应用于分类。给定两类或多类有标签的样本数据(labeled classes of data),它作为一个判别式的分类器(discriminative classifier),表现为构造一个最优的超平面(optimal hyperplane),能够将多个不同类别的样本间隔出来,也称为最大间隔分类器(max margin classifier)。新的样本进入分类器,通过learning algorithm被映射到相同的特征空间(feature space ),然后根据样本点落在超平面的哪一边进行分类。
What are Support Vectors?

支持向量(support vectors) 是离超平面最近的数据点, 决定了超平面的形成。如果将其去除,将会直接影响到分隔超平面的位置。支持向量被认为是数据中最重要的因素,也是构建SVM的至关重要的因素。
Whats a hyperplane?

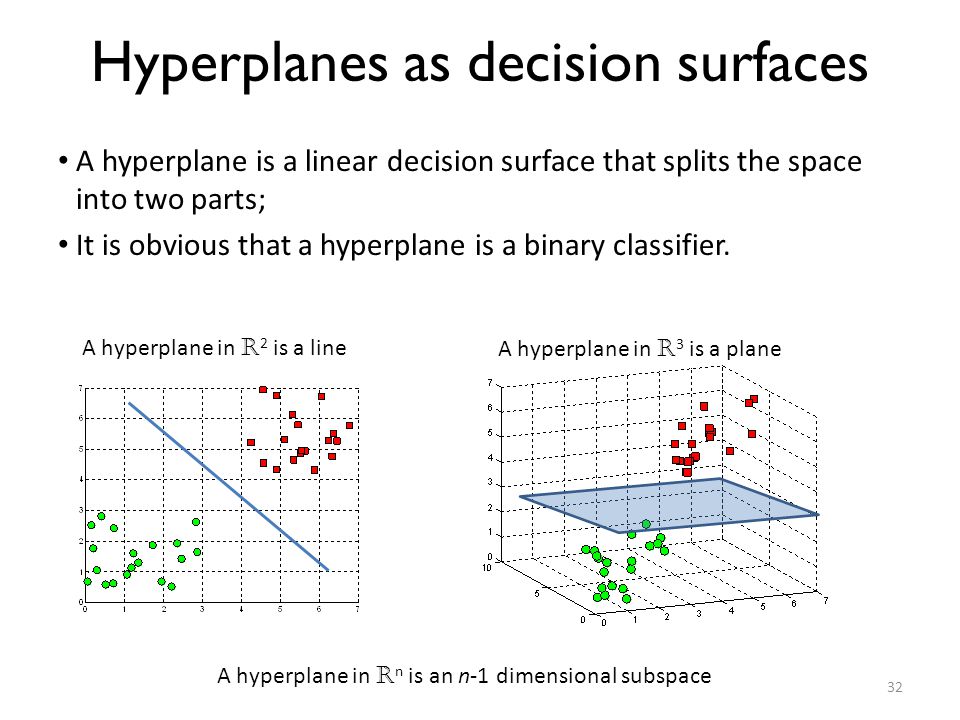
超平面是原始特征空间的一个子空间,它的维度比原始空间低一维。
比如,一个n维空间的超平面就是一个n-1维的flat subset, 将空间划分一半。
Linear vs nonlinear classification?
有时候我们的数据是线性可分的。这意味着对于拥有M个特征的N个类别样本,我们可以学习一个线性的函数映射,比如 y=mx+b,或者甚至一个多维的超平面,比如 y=x+z+b+q。不管有多少特征,我们都可以通过线性函数学习到合适的映射的关系。
但有时并不是(非线性可分), 像二次或多次映射。幸运的是,SVMs可以使用一种称为核技巧(kernel trick)的技术实现非线性的分类。

Let’s define our loss function (what to minimize) and our objective function (what to optimize)
Loss function
Hinge loss - 训练svm分类器的损失函数, 用于最大间隔分类器。

c - loss function, x - the sample, y - the true label, f(x) - the predicted label.

Objective Function

目标函数包含两个方面。
第一个是一个正则化项,第二个是损失。
正则化项权衡间隔的最大化以及损失,降低overfitting的风险。
我们希望找到能够最大分隔所有样本的决策界面。
How do we minimize our loss/optimize for our objective (i.e learn)?
梯度下降算法。我们需要计算出偏微分(目标函数对参数的梯度)因为这里有两个terms,需要对它们进行分别的偏微分。

这意味着,如果我们有误分类的样本,更新权重时,需要同时考虑着对这两个terms求解gradient。然而,如果分类正确,只需要考虑正则化项对权重的偏导(损失项为0)。
误分类

更新权重 (misclassified)

学习率代表着学习算法在降低训练误差沿着梯度下降时的步长。
- Learning rate too high? The algorithm might overshoot the optimal point.
- Learning rate too low? Could take too long to converge. Or never converge.
正则化项控制着获得一个较低的训练误差以及较低的测试误差,测试误差用来评价分类器的泛化能力(对没有见过的数据), 这里代码我们选择1/epochs 作为正则化项的值,所以随着epochs的增多,正则参数会降低。
- Regularizer too high? overfit (large testing error)
- Regularizer too low? underfit (large training error)
更新权重 (correctly classified)

Code
# code1import numpy as npfrom matplotlib import pyplot as plt#Step 1 - Define our data#Input data - Of the form [X value, Y value, Bias term]X = np.array([ [-2,4,-1], [4,1,-1], [1, 6, -1], [2, 4, -1], [6, 2, -1],])#Associated output labels - First 2 examples are labeled '-1' and last 3 are labeled '+1'y = np.array([-1,-1,1,1,1])#lets plot these examples on a 2D graph!#for each examplefor d, sample in enumerate(X): # Plot the negative samples (the first 2) if d < 2: plt.scatter(sample[0], sample[1], s=120, marker='_', linewidths=2) # Plot the positive samples (the last 3) else: plt.scatter(sample[0], sample[1], s=120, marker='+', linewidths=2)# Print a possible hyperplane, that is seperating the two classes.#we'll two points and draw the line between them (naive guess)plt.plot([-2,6],[6,0.5])plt.show()# code2def svm_sgd_plot(X, Y): # Initialize our SVMs weight vector with zeros(3 values) w = np.zeros(len(X[0])) eta = 1 # the learning rate epochs = 10000 # hwo many iterations to train for errors = [] # store misclassifications so we can plot how they change over time #training part, gradient descent part for epoch in range(1, epochs): error = 0 for i, x in enumerate(X): #misclassification if(Y[i]*np.dot(X[i], w)) < 1: #misclassified update for ours weights, the regularizer=1/epoch w = w - eta*(2*(1/epoch)*w - (X[i]*Y[i])) error = 1 else: #correct classification w = w - eta*(2*(1/epoch)*w) errors.append(error) # lets plor the rate of classification errors during training for our SVM plt.plot(errors, '|') plt.ylim(0.5, 1.5) plt.axes().set_yticklabels([]) plt.xlabel('Epoch') plt.ylabel('Misclassified') plt.show() return ww = svm_sgd_plot(X, y)for d, sample in enumerate(X): if d<2: plt.scatter(sample[0], sample[1], s=120, marker='_', linewidths=2) else: plt.scatter(sample[0], sample[1], s=120, marker='+', linewidths=2)# Add our test samplesplt.scatter(2, 2, s=120, marker='_', linewidths=2, color='yellow')plt.scatter(4, 3, s=120, marker='+', linewidths=2, color='blue')# Print the hyperplane calculated by svm_sgd()x2 = [w[0], w[1], -w[1], w[0]]x3 = [w[0], w[1], w[1], -w[0]]x2x3 = np.array([x2, x3])X, Y, U, V = zip(*x2x3)print(x2x3)print(X, Y, U, V)ax = plt.gca()ax.quiver(X, Y, U, V, scale=1, color='blue')- Intelligence Math Part2
- Intelligence Math Part1
- Intelligence Math Part3
- part2
- PART2
- Math
- math
- Math
- Math
- Math
- Math
- math
- Math
- math
- Math
- Math
- Math
- Math
- 牛客网wannafly 4,b题(小AA的数列
- JAVA 类声明中关键字public的作用
- 《基础网页制作》div加float实现一个简单的首页
- 我的学习记录46
- redis清空缓存
- Intelligence Math Part2
- 深入理解乐观锁与悲观锁
- matlab图像处理之RGB转Ycbcr or gray
- MyBatis学习笔记(二)--配置环境详解
- leetcode 136-Single Number
- C++中几种读取数据的函数的用法
- MPAndroidChart开源图表库的使用介绍之饼状图、折线图和柱状图
- 操作系统进程调度算法(Java 实现)
- Webpack 3.x 尝试使用Pug(Jade)模板引擎


