kmeans++
来源:互联网 发布:java math 生成随机数 编辑:程序博客网 时间:2024/05/29 17:25
原文地址:https://www.cnblogs.com/nocml/p/5150756.html
k-means++算法选择初始seeds的基本思想就是:初始的聚类中心之间的相互距离要尽可能的远。wiki上对该算法的描述如下:
- 从输入的数据点集合中随机选择一个点作为第一个聚类中心
- 对于数据集中的每一个点x,计算它与最近聚类中心(指已选择的聚类中心)的距离D(x)
- 选择一个新的数据点作为新的聚类中心,选择的原则是:D(x)较大的点,被选取作为聚类中心的概率较大
- 重复2和3直到k个聚类中心被选出来
从上面的算法描述上可以看到,算法的关键是第3步,如何将D(x)反映到点被选择的概率上,一种算法如下:
- 先从我们的数据库随机挑个随机点当“种子点”
- 对于每个点,我们都计算其和最近的一个“种子点”的距离D(x)并保存在一个数组里,然后把这些距离加起来得到Sum(D(x))。
- 然后,再取一个随机值,用权重的方式来取计算下一个“种子点”。这个算法的实现是,先取一个能落在Sum(D(x))中的随机值Random,然后用Random -= D(x),直到其<=0,此时的点就是下一个“种子点”。
- 这个Random 可以这么取: Random = Sum(D(x)) * 乘以0至1之间的一个小数
- 之所以取一个能落在Sum(D(x))中是值是因为,Random是随机的,那么他有更大的机率落在D(x)值较大的区域里。如下图,Random有更大的机率落在D(x3)中。
- Random -= D(x) 的意义在于找出 当前Random到底落在了哪个区间。
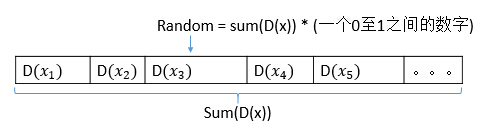
从上图可以看出,假设Random落在D(x3)这个区间内,“然后用Random -= D(x),直到其<=0”此时找到的点就是D(x3),就是这步的中心点。
- 重复2和3直到k个聚类中心被选出来
- 利用这k个初始的聚类中心来运行标准的k-means算法
from math import pi, sin, cosfrom collections import namedtuplefrom random import random, choicefrom copy import copytry: import psyco psyco.full()except ImportError: passFLOAT_MAX = 1e100class Point: __slots__ = ["x", "y", "group"] def __init__(self, x=0.0, y=0.0, group=0): self.x, self.y, self.group = x, y, groupdef generate_points(npoints, radius): points = [Point() for _ in xrange(npoints)] # note: this is not a uniform 2-d distribution for p in points: r = random() * radius ang = random() * 2 * pi p.x = r * cos(ang) p.y = r * sin(ang) return pointsdef nearest_cluster_center(point, cluster_centers): """Distance and index of the closest cluster center""" def sqr_distance_2D(a, b): return (a.x - b.x) ** 2 + (a.y - b.y) ** 2 min_index = point.group min_dist = FLOAT_MAX for i, cc in enumerate(cluster_centers): d = sqr_distance_2D(cc, point) if min_dist > d: min_dist = d min_index = i return (min_index, min_dist)def kpp(points, cluster_centers): cluster_centers[0] = copy(choice(points)) d = [0.0 for _ in xrange(len(points))] for i in xrange(1, len(cluster_centers)): sum = 0 for j, p in enumerate(points): d[j] = nearest_cluster_center(p, cluster_centers[:i])[1] sum += d[j] sum *= random() for j, di in enumerate(d): sum -= di if sum > 0: continue cluster_centers[i] = copy(points[j]) break for p in points: p.group = nearest_cluster_center(p, cluster_centers)[0]def lloyd(points, nclusters): cluster_centers = [Point() for _ in xrange(nclusters)] # call k++ init kpp(points, cluster_centers) lenpts10 = len(points) >> 10 changed = 0 while True: # group element for centroids are used as counters for cc in cluster_centers: cc.x = 0 cc.y = 0 cc.group = 0 for p in points: cluster_centers[p.group].group += 1 cluster_centers[p.group].x += p.x cluster_centers[p.group].y += p.y for cc in cluster_centers: cc.x /= cc.group cc.y /= cc.group # find closest centroid of each PointPtr changed = 0 for p in points: min_i = nearest_cluster_center(p, cluster_centers)[0] if min_i != p.group: changed += 1 p.group = min_i # stop when 99.9% of points are good if changed <= lenpts10: break for i, cc in enumerate(cluster_centers): cc.group = i return cluster_centersdef print_eps(points, cluster_centers, W=400, H=400): Color = namedtuple("Color", "r g b"); colors = [] for i in xrange(len(cluster_centers)): colors.append(Color((3 * (i + 1) % 11) / 11.0, (7 * i % 11) / 11.0, (9 * i % 11) / 11.0)) max_x = max_y = -FLOAT_MAX min_x = min_y = FLOAT_MAX for p in points: if max_x < p.x: max_x = p.x if min_x > p.x: min_x = p.x if max_y < p.y: max_y = p.y if min_y > p.y: min_y = p.y scale = min(W / (max_x - min_x), H / (max_y - min_y)) cx = (max_x + min_x) / 2 cy = (max_y + min_y) / 2 print "%%!PS-Adobe-3.0\n%%%%BoundingBox: -5 -5 %d %d" % (W + 10, H + 10) print ("/l {rlineto} def /m {rmoveto} def\n" + "/c { .25 sub exch .25 sub exch .5 0 360 arc fill } def\n" + "/s { moveto -2 0 m 2 2 l 2 -2 l -2 -2 l closepath " + " gsave 1 setgray fill grestore gsave 3 setlinewidth" + " 1 setgray stroke grestore 0 setgray stroke }def") for i, cc in enumerate(cluster_centers): print ("%g %g %g setrgbcolor" % (colors[i].r, colors[i].g, colors[i].b)) for p in points: if p.group != i: continue print ("%.3f %.3f c" % ((p.x - cx) * scale + W / 2, (p.y - cy) * scale + H / 2)) print ("\n0 setgray %g %g s" % ((cc.x - cx) * scale + W / 2, (cc.y - cy) * scale + H / 2)) print "\n%%%%EOF"npoints = 30000k = 7 # # clusterspoints = generate_points(npoints, 10)cluster_centers = lloyd(points, k)#print_eps(points, cluster_centers)import matplotlib.pyplot as pltx1=[p.x for p in points]y1=[p.y for p in points]s=[p.group+1 for p in points]c=[(p.group+1)*30 for p in points]x2=[cluster_centers[i].x for i in range(7)]y2=[cluster_centers[i].y for i in range(7)]fig1=plt.figure(1,figsize=(10,10))ax1=fig1.add_subplot(111)ax1.scatter(x1,y1,s,c)ax1.scatter(x2,y2,s=30,c='r')plt.show()
x2=[cluster_centers[i].x for i in range(7)]y2=[cluster_centers[i].y for i in range(7)][3.043193729843852, -3.1455444087351316, -0.027387910603946075, -3.1373251505957964, 6.293835167173367, -6.354970289219109, 3.2213924574115036]阅读全文
0 0
- Kmeans
- KMeans
- Kmeans
- KMeans
- KMeans
- kmeans
- Kmeans
- Kmeans
- Kmeans
- Kmeans
- kmeans
- kmeans++
- Kmeans
- kmeans
- Kmeans++
- KMeans
- Kmeans
- Kmeans++
- 阿里云服务器Java+Mysql+Tomcat环境搭建(Mac OS下配置)
- 远程桌面无法使用剪切板的解决方法
- unity滚动层dotween移动到指定索引
- leetcode解题方案--062--Unique Paths
- 实验三 二进制补码加法器
- kmeans++
- 笔试题(一)—— java基础
- 【笔记】AOE网与关键路径
- ThinkPHP5.1 不需要控制器的路由 \类的命名空间\类名@方法名
- C 标准库
- 浅谈Spring中的IOC和AOP概念
- [译]用于语义分割的全卷积网络 FCN(UC Berkeley)
- Java的基本数据类型与转换
- csapp-lab6 malloc-lab