机器学习实用教程(译)-2
来源:互联网 发布:nginx编译pagespeed 编辑:程序博客网 时间:2024/06/16 05:44
day one习题答案:1. What are the 5 core steps of the machine learning workflow?Exploratory AnalysisData CleaningFeature EngineeringAlgorithm SelectionModel Training2. When the curious child learned that "red and bright means pain," what did he learn?(D) He learned both a pattern and a model.“Red and bright means pain” is a pattern, and it became his model for dealing with bright, red objects.Presumably, he could continue adding to that model. For example, a red and bright toy car would form a different pattern (and heat may become the distinguishing factor).3. In the example of the curious child, what was the training data? What was the test data?The training data was the candle flame.The test data was the stove top. However, in this situation, we typically refer to the stove top as “unseen data.”4. In your own words, describe the 3 essential elements of great machine learning.The first element is a “skilled chef.” You must make dozens of decisions along the way.The second element is “fresh ingredients.” The quality of your data determines the effectiveness of your models.The third element is to “avoid overcooking it.” Overfitting a serious pitfall, and you must take precautions.2.探索性分析(Exploratory Analysis)
2.1 简介
探索性分析可以让你对数据集有一个大致的了解,对后面的数据清洗、特征设计的环节都有很大的帮助,还可以帮助你理解最终结论。
这个环节不需要花费太多时间,只要快速过一遍即可。但也不建议跳过。
2.2 基本信息
先对数据集做一个大致的了解:
有多少个样本?
有多少个特征?
样本特征都有什么数据类型?是否数字特征或者分类特征?
我的目标变量是什么?
抽样查看:
抽取数据集中的几个样本进行查看,对数据集样本又一个大致了解:
字段名定义是否合理?
字段值是否合理?
字段值的范围是否合理?
目测分析样本中丢失的数据是否会导致大问题?
2.3 数字型特征的展示
使用直方图展示特征值后,检查是否有以下情况出现:
不合理的异常值
二分值的特征(例如:指示变量)
不合理的上下限
可能存在的测量错误 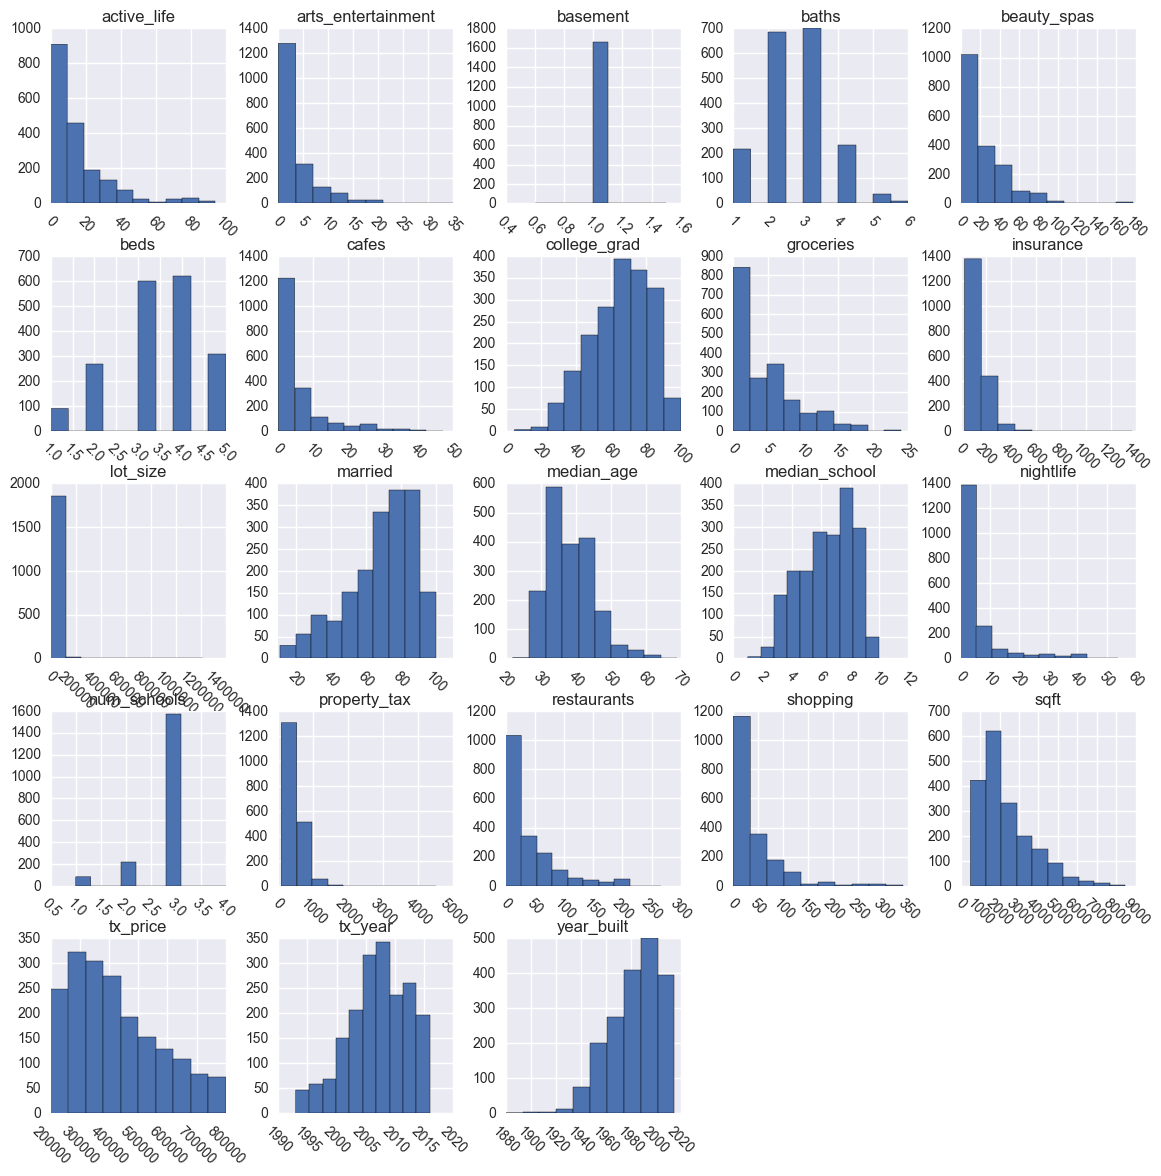
2.4 分类型特征的展示
通过条形图图展示。
目测查看图形,留意稀疏的分类,稀疏分类有可能导致算法的“过拟合”。 
2.5 分段图形(Segmentations)
分段图形是观察分类特征和数字型特征之间关系的重要方法。
Box plots就是一个例子,从下面图形中,可以得到以下信息: 
1)两个分类各自的交易价格中位数
2)两个分类的交易价格最大值和最小值
3)数据截断区间(200-800)
4)对于评估模型的通用性很重要。
2.6 相关性(Correlations)
相关性可以观察数字特征之间的关系。
相关性是一个 -1 到 1 的值,值为正时,代表正相关,值为负时,代表负相关;数字越接近 -1 或 1,代表相关性越大;数字越接近0,代表相关性越小;0代表不相关。
相关热力图(Correlation heatmaps)可以查看相互之间的相关性: 
2.7 课后习题
1.What types of features can have sparse classes? How would you check for them?
2.What does it mean if ‘sqft’ (size of property) has a correlation of 0.68 with ‘baths’ (# of bathrooms)?
3.What are 3 sanity checks to make by looking at example observations from the dataset?
- 机器学习实用教程(译)-2
- 机器学习实用教程(译)-1
- 机器学习实用教程(译)-3
- 机器学习实用教程(译)-4
- Java 2实用教程 学习之类与程序
- Java 2实用教程 学习之如何使用对象
- 【译】Git实用教程
- 实用教程
- 《精通struts2实用教程》学习笔记-01
- [译]机器学习简史
- 机器学习 2
- 机器学习-笔记2
- 机器学习2决策树
- 机器学习简史2
- Spark机器学习2
- 机器学习2
- 机器学习入门2
- 机器学习2
- CSS的属性选择符
- 完美解决主工程与lib库的FileProvider冲突
- 深度学习系列笔记之编程基础(python)
- IntelliJ IDEA下的使用git
- 【1701H1】【穆晨】【171204】连续第五十五天总结
- 机器学习实用教程(译)-2
- 一些c/c++小题目的总结1
- 编程之路
- Node.js-创建Web服务器和TCP服务器
- Spring整理系列(17)————循序渐进了解spring事务管理的几种方式
- spring boot微服务通用部署启动脚本
- 这几个问题答不对,就别说精通TCP
- ScrollView中嵌套高德地图MapView,解决触摸冲突
- 计算机的潜意识