directshow debugging tips
来源:互联网 发布:测试网络丢包率的命令 编辑:程序博客网 时间:2024/05/17 07:02
1. View graph
4. open source graphedit replacement
http://blog.monogram.sk/janos/tools/monogram-graphstudio/
When we render a media file, directshow uses intelligent connect to build a working graph for us. It may add some filters implicitly if necessary. From my perspective, it all happens transparently. It's user friendly and powerful. But while debugging, we need to know exactly how is the graph constructed and connected, at runtime. Directshow provided a utility method AddGraphToRot in %WINSDK%/Samples/multimedia/directshow/common/dshowutil.h. We can use it to register our graph to running object table, and then view the graph in graphedit. After the graph has been registered, we select File - Connect to Remote Graph in graphedit to bring up remote filter graph list. Then select the registered graph to view.

2. Keep log
IGraphBuilder exposes a SetLogFile method that can be used to specify a log file. Once set, all of the graph's activities will be saved to the log file, including how filter's are connected, how the graph attempted to connect pins. These information are valuable for debugging filters.
pGraph->SetLogFile((DWORD_PTR)CreateFile(TEXT("C://graph_builder.log"), GENERIC_WRITE, 0, NULL, CREATE_NEW, FILE_ATTRIBUTE_NORMAL, NULL));
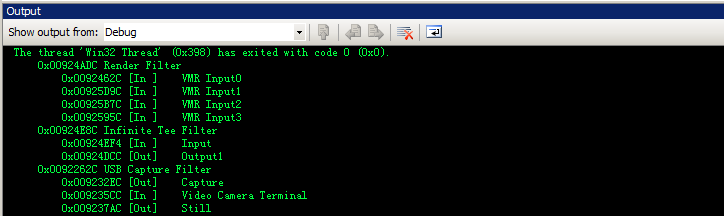
3. Dump graph
In the log file generated by graph, components (filter and pin) are identified with their address in memory. The friendly name of the component isn't shown which make the log file harder to understand by human. Here is a small utility function that dumps all filters and their pins with corresponding memory address and name, in the format shown below.
http://code.google.com/p/rxwen-blog-stuff/source/browse/trunk/multimedia/directshow/graphdump.cpp
4. open source graphedit replacement
http://blog.monogram.sk/janos/tools/monogram-graphstudio/
- directshow debugging tips
- Debugging Tips
- Veritas Cluster Debugging Tips
- Veritas Cluster Debugging Tips
- Kernel Debugging Tips
- Kernel Debugging Tips
- Basic debugging & tips using NTSD
- Tips for debugging on Linux
- Top 10 Java Debugging Tips with Eclipse
- Compiling, Linking and Debugging Tips for C++
- Top 10 Java Debugging Tips with Eclipse
- Top 10 Java Debugging Tips with Eclipse
- Perl Hacks : Tips & Tools for Programming, Debugging, and Surviving
- 20 debugging tips for native development with Visual Studio
- 10 Useful Tips For Debugging and Troubleshooting in Programming
- 【转】Top 10 Java Debugging Tips with Eclipse
- Debugging Tips and Tricks for C++ in Visual Studio
- GDB Tutorial: Advanced Debugging Tips For C/C++ Programmers
- why I prefer wireshark to network monitor
- standalone windbg v6.12.0002.633
- Use google.com instead of google.com.hk
- Override CheckMediaType with care
- Thoughts on directshow
- directshow debugging tips
- Total Commander, what a weapon!
- change command prompt font
- getting start with osip
- 跨域(cross-domain)访问 cookie (读取和设置)
- native programming with android building system
- windbg sos.dll version issue
- 】【又写了个 JavaScript 小游戏】
- Ex 15.4-5 of introduction to algorithms