Matlab实现霍夫变换_优化版
来源:互联网 发布:员工数据库设计 编辑:程序博客网 时间:2024/05/02 17:01
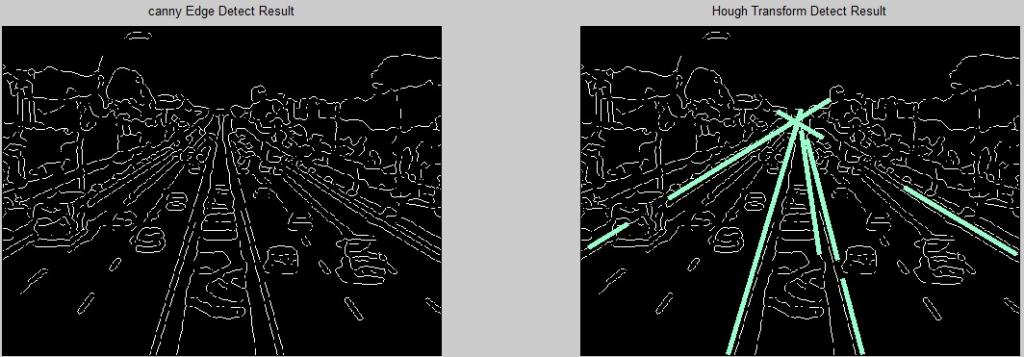
在上一篇博客中发现经过霍夫变换检测出的直线有可能因为车辆挡住路沿等原因断开,形成线段,这样就不好了,因为检测道路是要找直线焦点。
Thus it is necessary to combine 相同斜率的直线 and connect them.
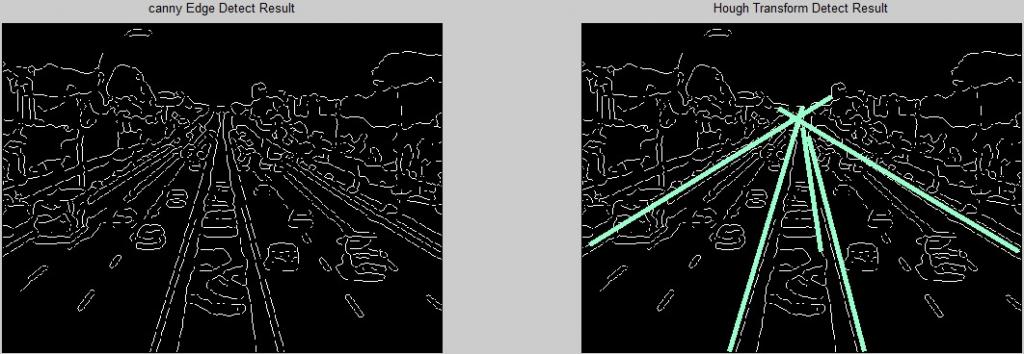
本代码提供了matlab下求取经过霍夫变换的直线斜率,并将其联合,代码见下方,实验结果见文末。
% 入口图像为 BW,出口图像为f%optimize from main_optimize, merely select 2 lines, one has positive%slope,the other has negative slopeclear all,close allBW=imread('D:\Images\NEW\img4b9faef664e03.jpg');figure,imshow(BW);BW=rgb2gray(BW);%thresh=[0.01,0.17];thresh=[0.01,0.10];sigma=2;%定义高斯参数f = edge(double(BW),'canny',thresh,sigma);figure,subplot(121);imshow(f,[]);title('canny Edge Detect Result');[H, theta, rho]= hough(f, 0.1);%cos(theta)*x+sin(theta)*y=rho%imshow(theta,rho,H,[],'notruesize'),axis on,axis normal%xlabel('\theta'),ylabel('rho');[r,c]=houghpeaks(H,10);hold onlines=houghlines(f,theta,rho,r,c);subplot(122);imshow(f,[]),title('Hough Transform Detect Result'),hold onnlind=0;%new line indexst=1;%%%%%%%%%求斜率%%%%%%%%%%%%for k=1:length(lines) %xy=[lines(k).point1;lines(k).point2]; xielv(k)=(lines(k).point2(1)-lines(k).point1(1))/(lines(k).point2(2)-lines(k).point1(2)+0.0001)end%%%%%%%%%将相同斜率的直线连起来%%%%%%%%%%%%k=1;while(k<=length(lines)) if(k~=length(lines)) k=k+1; end while(abs(xielv(k)-xielv(k-1))<0.0001) k=k+1; if(k>length(lines)) break; end end if(abs(xielv(k-1))<0.05||abs(xielv(k-1))>=10)%eliminate horizontal and vertical lines,防治水平线和楼房 st=k; if(k~=length(lines)) continue; end end if(st==length(lines)&&k==st) if(abs(xielv(k))>0.05&&abs(xielv(k))<10) nlind=nlind+1; newlines(nlind)=lines(st); newlines(nlind).point2=lines(k).point2; newxy=[newlines(nlind).point1;newlines(nlind).point2]; plot(newxy(:,2),newxy(:,1),'LineWidth',4,'Color',[.6 1.0 .8]); end break; end %end=k-1,start=st; draw line nlind=nlind+1; newlines(nlind)=lines(st); newlines(nlind).point2=lines(k-1).point2; newxy=[newlines(nlind).point1;newlines(nlind).point2]; plot(newxy(:,2),newxy(:,1),'LineWidth',4,'Color',[.6 1.0 .8]); st=k;endfprintf('%d lines are detected in sum.\n',nlind);实验结果:
原图:

未优化的霍夫变换:
优化后:
- Matlab实现霍夫变换_优化版
- 霍夫变换的matlab实现
- Matlab实现——霍夫变换直线检测
- 霍夫变换检测直线--原理和Matlab实现
- 霍夫变换直线检测的matlab实现
- Matlab实现FFT变换
- Matlab实现FFT变换
- MATLAB 实现Hough变换
- matlab 霍夫变换—检测圆
- matlab 图像分割 hough 霍夫变换
- matlab 图像分割 hough 霍夫变换
- matlab 霍夫变换—检测圆
- matlab实现信号的变换
- DCT变换及matlab实现
- matlab实现信号的变换
- matlab实现图像DCT变换
- 10基于opencv的霍夫变换(霍夫线变换_霍夫圆变换)
- 距离变换 matlab实现 opencv实现
- 【C语言】起源
- [分享]管理趣谈:纪晓岚与和珅的360度绩效考评
- 明确告诉大家:ArcToolbox无法将北京54或西安80坐标系转换到WGS84
- 测试计划文档如何写
- Android3系列 -1.环境搭建(傻瓜式集成环境下载)
- Matlab实现霍夫变换_优化版
- java在linux下安装
- dojo是什么?
- Java软件低级错误(十二):Java的移位(>>和>>>)运算问题
- java中的断言assert
- error while loading shared libraries: libcudart.so.3: wrong ELF class: ELFCLASS32 的解决
- Tomcat加入系统服务
- 基类包括字段“Top2_1”,但其类型(top2)与控件(ASP.top2_ascx)的类型不兼容
- 什么是WEB2.0