数字图像处理之点运算
来源:互联网 发布:光伏产业数据 编辑:程序博客网 时间:2024/05/01 14:36
-------------------------------------------------------------------------------------------------------------------
灰度直方图imhist
IMHIST(I) displays a histogram for the intensity image I whose number of
bins are specified by the image type. If I is a grayscale image, IMHIST
uses 256 bins as a default value. If I is a binary image, IMHIST uses
only 2 bins.
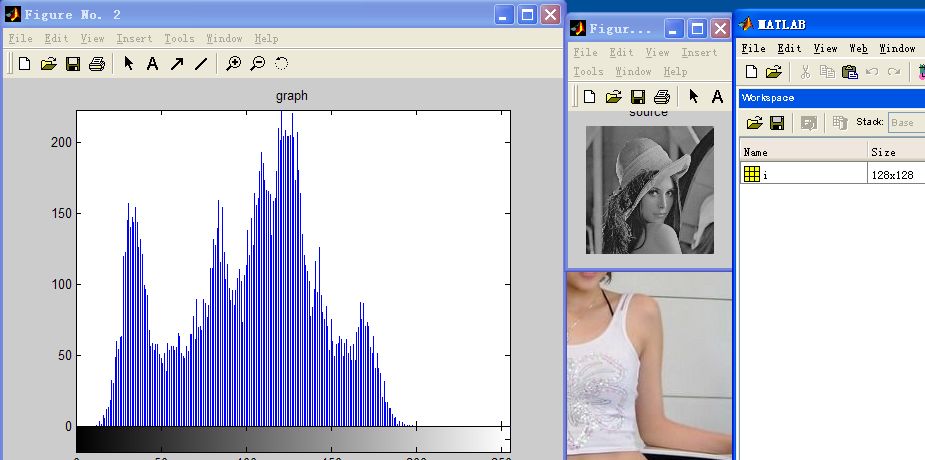
直方图的峰值位置说明了图像总体上的亮暗,如果图像较暗,峰值靠左;反之靠右。
另外:
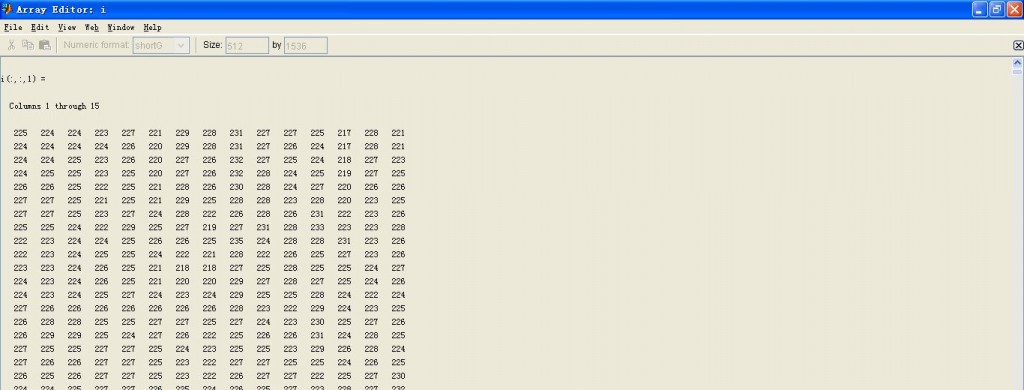
在workspace中显示i=128x128,即单通道128x128.观察图像数据如下

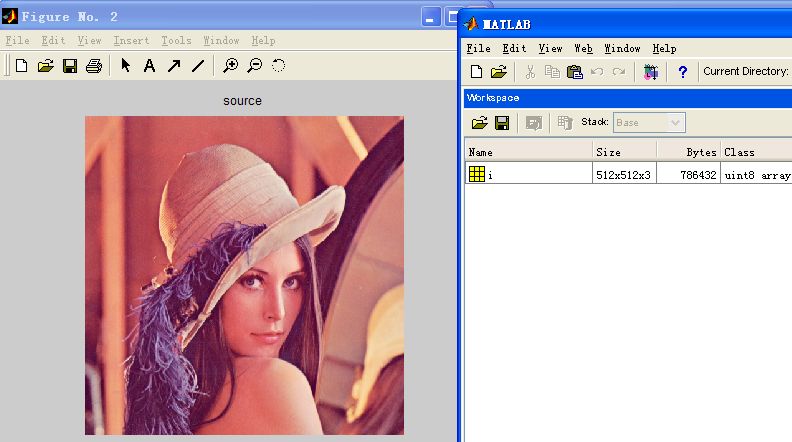
而如果是彩色rgb图像如
双击i也可查看每个像素点的值
--------------------------------------------------------------------------------------------------------------------------------------------------------------------------
灰度阈值变换im2bw
IM2BW Convert image to binary image by thresholding.
IM2BW produces binary images from indexed, intensity, or RGB
images. To do this, it converts the input image to grayscale
format (if it is not already an intensity image), and then
converts this grayscale image to binary by thresholding.
灰度直方图imhist
IMHIST(I) displays a histogram for the intensity image I whose number of
bins are specified by the image type. If I is a grayscale image, IMHIST
uses 256 bins as a default value. If I is a binary image, IMHIST uses
only 2 bins.
i=imread('lena.gif'); %灰度图像,128x128imshow(i);title('source');%显示源图像figure;imhist(i);title('graph');%显示灰度直方图直方图的峰值位置说明了图像总体上的亮暗,如果图像较暗,峰值靠左;反之靠右。
另外:
在workspace中显示i=128x128,即单通道128x128.观察图像数据如下
而如果是彩色rgb图像如
i=imread('lena.jpg'); %图像,512x512x3imshow(i);title('source');%显示源图像双击i也可查看每个像素点的值
--------------------------------------------------------------------------------------------------------------------------------------------------------------------------
灰度阈值变换im2bw
IM2BW Convert image to binary image by thresholding.
IM2BW produces binary images from indexed, intensity, or RGB
images. To do this, it converts the input image to grayscale
format (if it is not already an intensity image), and then
converts this grayscale image to binary by thresholding.
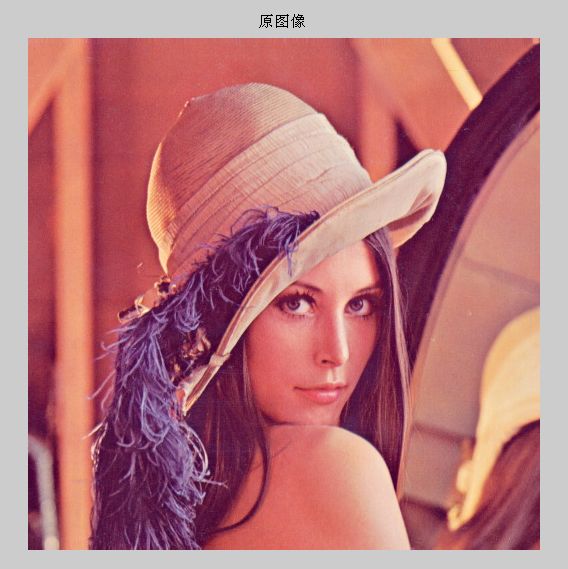
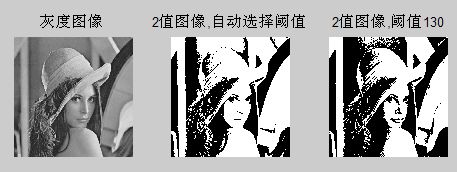
rgb=imread('lena.jpg');imshow(rgb);title('原图像');figure;i=rgb2gray(rgb);%先转化成灰度图像,也可以不转,因为im2bw会自动转subplot(1,3,1);imshow(i);title('灰度图像');threshold=graythresh(i);bw1=im2bw(i,threshold);subplot(1,3,2);imshow(bw1);title('2值图像,自动选择阈值');bw2=im2bw(i,130/255);subplot(1,3,3);imshow(bw2);title('2值图像,阈值130'); - 数字图像处理之点运算
- 数字图像处理之几何运算
- 数字图像处理:第四章 点运算
- 数字图像学习一之点运算
- Matlab数字图像处理之图像运算
- 数字图像学习点运算
- (5)Air Band数字图像处理基础-图像的点运算
- 数字图像处理之数字图像基础
- 【数字图像处理学习笔记之五】形态学开闭运算
- OpenCV数字图像处理一:数学基础及相关运算:点运算
- OpenCV数字图像处理三:数学基础及相关运算:点运算
- 数字图像处理成长之路11:harris角点检测
- 【数字图像处理】五.MFC图像点运算之灰度线性变化、灰度非线性变化、阈值化和均衡化处理详解
- 数字图像处理:10.形态学运算
- 数字图像处理之概述
- OpenCV数字图像处理二:代数运算
- 数字图像处理3---图像基本运算
- 数字图像处理3---图像基本运算--续
- 文件类型的区分
- C语言实现 vector( 动态数组)
- Win 7下使用DNW方法(个人总结)
- [gpu pro2]pre integrated skin shading
- asp.net权限控制
- 数字图像处理之点运算
- 数字图像处理之几何变换
- 数字图像处理之空间域图像增强
- 11.5 完整的服务: 雅虎开发人员网络以及 YUI
- 数字图像处理之频率域图像增强
- 股票买卖
- jQuery基础
- 超轻量级的Gow,替代cgwin
- cin,cout,以及其返回值