Using Breakpoints in Xcode
来源:互联网 发布:怎么样找网络推手 编辑:程序博客网 时间:2024/05/16 19:12
if you’ve used Xcode you’re probably familiar with the basics of breakpoints. Place a little marker in the sidebar and when your code reaches that point, everything pauses at that point so you can take a peek, look around, and see what’s going on with variables and the call stack1. Xcode breakpoints offer a number of different features and creating breakpoints can go way beyond clicking the sidebar. Let’s take a look.
Breakpoint Basics
So we’re all on the same page, here’s some of the basics for working with breakpoints in Xcode.
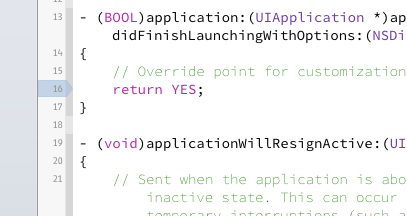
You can add breakpoints at any time, before or after your code is already running. There’s no need to recompile your app for breakpoints to work. To add a breakpoint, click the line number next to the code where you would like to pause. A blue arrow will appear indicating the breakpoint’s position:

This is a simple breakpoint. When you run your app and it reaches this point in execution, everything will pause until you tell the process to continue on.
You can temporarily disable the breakpoint by clicking it again. The breakpoint will become transparent to indicate it’s temporarily disabled.
You can simply click it again to re-enable it. Breakpoints you disable will be ignored and act as if they aren’t there.
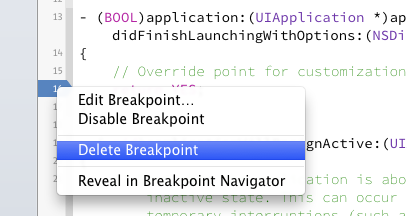
To remove a breakpoint, you either right-click and select “Delete Breakpoint”, or drag the breakpoint off the bar.
The breakpoint indicators along the edge of your code are great when you’re looking at individual files but when you want an overview of all the breakpoints in your project, you can take a look in the Breakpoint Navigator (⌘7):
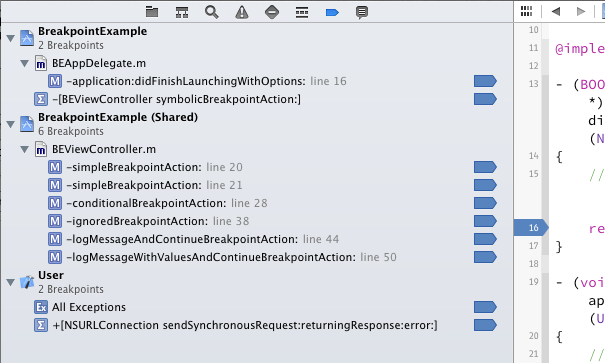
The Breakpoint Navigator will show you all the breakpoints that are set in your current workspace or project. It also allows you to edit and delete breakpoints (along with creating some special ones you’ll see shortly). If you select a breakpoint in the navigator, you’ll automatically be shown the associated code where the breakpoint is positioned.
Your breakpoints are organized by project/workspace and grouped by file. Your breakpoint configurations are stored in your Project Name.xcodeproj and Workspace Name.xcworkspace files. In general, configurations are actually stored in the sub pathxcuserdata/username.xcuserdatad/xcdebugger/Breakpoints_v2.xcbkptlistin your project or workspace. Breakpoints can also be shared among your co-workers on the same project (stored in xcshareddata). Just for you, breakpoints can be set as User breakpoints that will appear only for you but also across all your projects. User breakpoints are stored internally in Xcode preferences. You can change the configuration location of individual breakpoint by right clicking them and selecting the appropriate type.
Sample Project
So you can easily follow along with this post, I’ve created a sample project on GitHub that already has all of the following breakpoints you are about to see. The demo project’s breakpoints are all set to beshared breakpoints so you can see them too. Ideally a few would be better as a user breakpoint but I’ll point that out later.
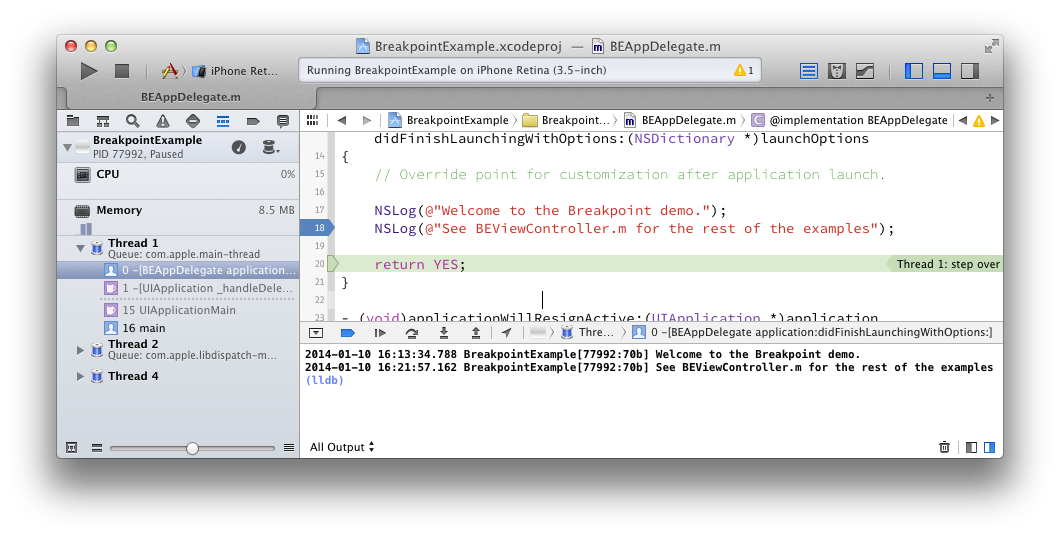
Download the project and run it in the iOS simulator. Xcode will immediately stop at the breakpoint in the app delegate’sapplication:didFinishLaunchingWithOptions: method.
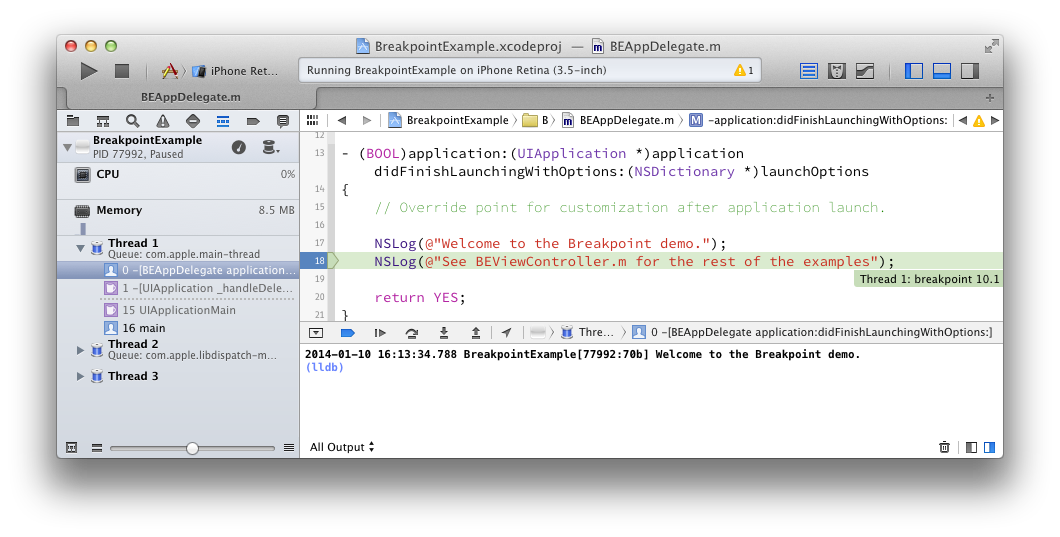
You’ll notice the breakpoint is highlighted with a green line indicating where the code stopped. Xcode has also automatically displayed theDebug Navigator on the left, which shows that the breakpoint has stopped in Thread 1 (Queue: com.apple.main-thread). As well, Xcode has displayed the Debug Area with the console/log for the current execution. If you’re running the demo app, the console should showWelcome to the Breakpoint demo but you’ll notice that Xcode hasn’t logged the line highlighted in green by the breakpoint. The breakpoint stops before the current line is executed so if you want to see the next log message, you need to continue execution using the debug controls:

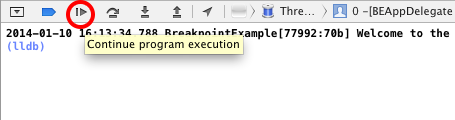
You can do this by clicking the Continue button:
or the Step Over button:
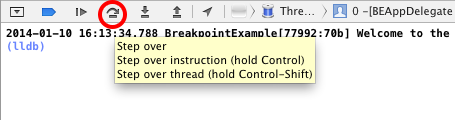
The difference is that Continue will allow the code to run until it hits the next breakpoint (if any) and Step Over will simply stop at the immediate next line of code as shown here where Step Over stopped at the return statement2.
For now, remove or disabled this initial breakpoint so that the app doesn’t stop every time you Run the app in the debugger.
Now that you have a basic understanding of creating breakpoints, where to find them, and how to navigate the paused code, let’s have some fun with customizing the breakpoints.
Customizing Breakpoints
As you probably noticed earlier, you can right click on a breakpoint and select “Edit Breakpoint…” to get a lot more options. Breakpoints can be configured to conditionally stop, be ignored until a specific iteration, automatically continue after evaluating, and perform additional actions such as running scripts, debugger commands, logging messages and playing sounds.
Conditional Breakpoints
Tap the “Conditional Breakpoint” button in the demo iOS app and Xcode will stop in the conditionalBreakpointAction: selector:
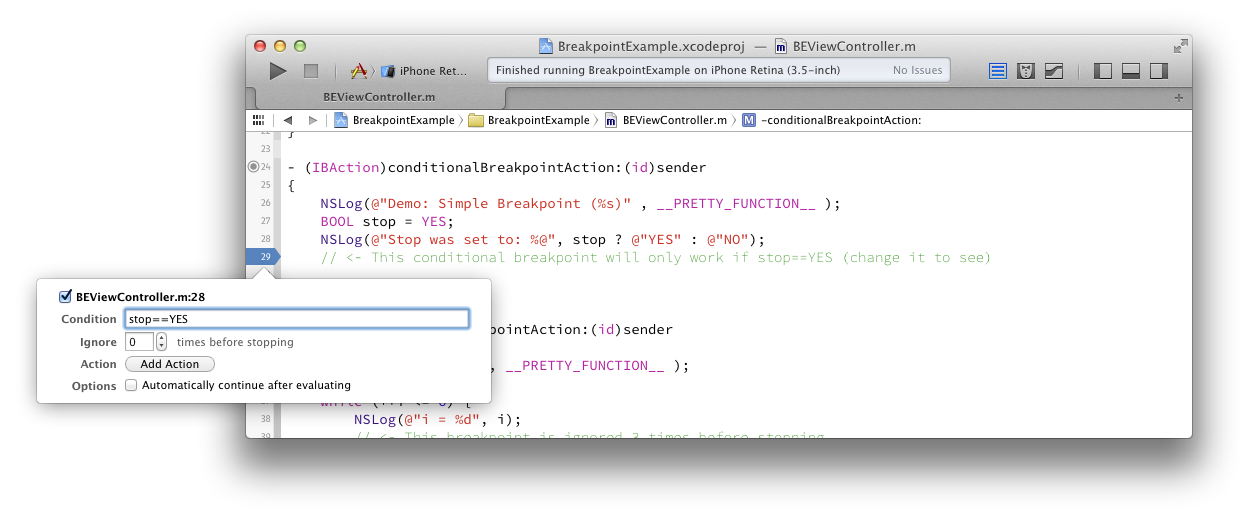
This breakpoint has the condition stop==YES so it will only work if theconditionalBreakpointAction method’s stop variable is true.
If you change stop to NO and re-compile the app:
BOOL stop = NO;the breakpoint will always be skipped. Your breakpoint condition can be any code that evaluates true or false. For example, if you only want the breakpoint to stop when running on the main thread, you could use[NSThread isMainThread] as your condition.
Ignored Breakpoints
Tap the “Ignored Breakpoint” button in the demo iOS app and Xcode will stop in the ignoredBreakpointAction: selector:
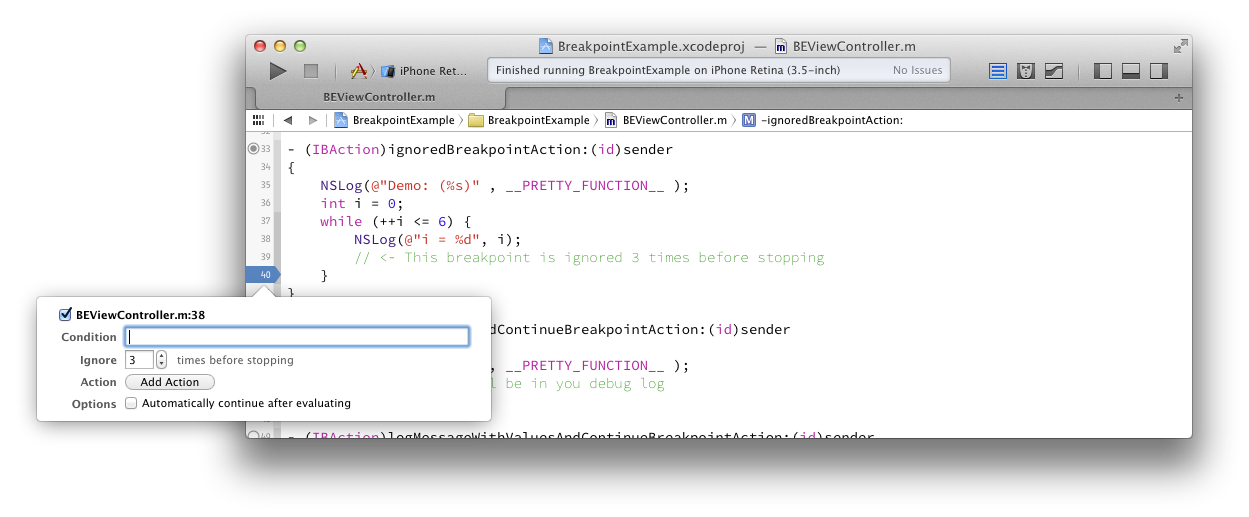
This breakpoint is inside a while loop and has the ignore option set to 3. As a result, the breakpoint will not break execution until the fourth iteration of the loop. You can see this by examining the Debugger Console log message. When the execution stops your app, there will be three log messages from the first three iterations. When you press continue, the current iteration will complete and the breakpoint will stop again in every iteration thereafter (only your first three iterations were skipped).
Log Message and Continue Breakpoints
Tap the “Log Message and Continue Breakpoint” button in the demo iOS app and Xcode will evaluate the breakpoint in thelogMessageBreakpointAction: selector:
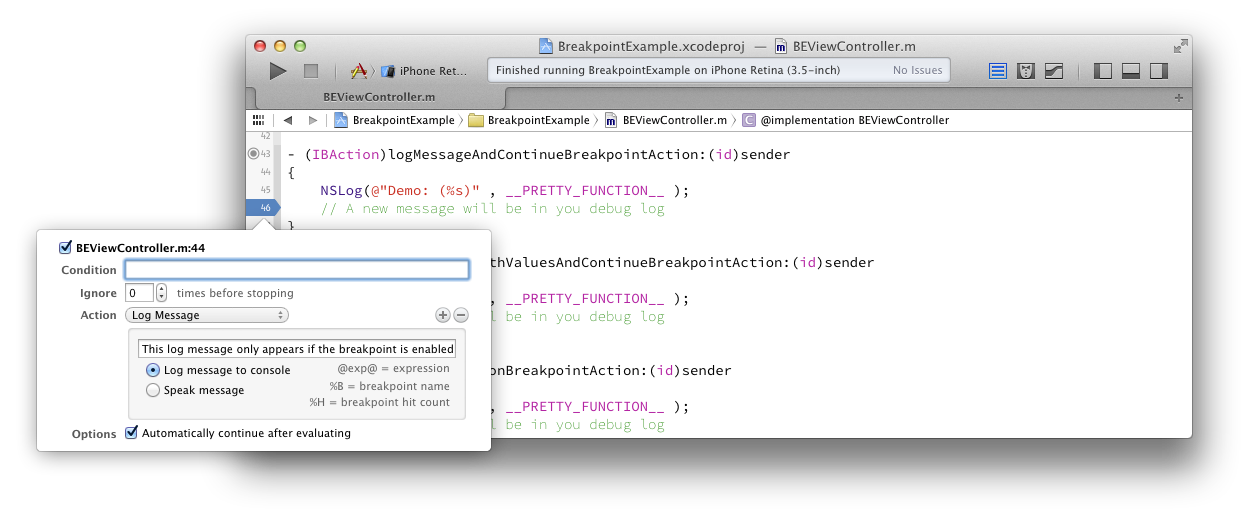
As demonstrated here, your breakpoints don’t need to halt the code to be useful and can simply provide additional log information through additional actions. As a result, a breakpoint can replace the need to callNSLog for debugging purposes. Breakpoints also have the advantage over NSLog where you don’t need to recompile the app to add a new log message. If you get stuck at a certain point and need some detailed log output you can just add breakpoints like these and log whatever you need. These log messages won’t accidentally ship with the live app and can be disabled and enabled as necessary.
Log Message and Values Breakpoints
Tap the “Log Message and Values Breakpoint” button in the demo iOS app and Xcode will stop in thelogMessageWithValuesAndContinueBreakpointAction: selector:
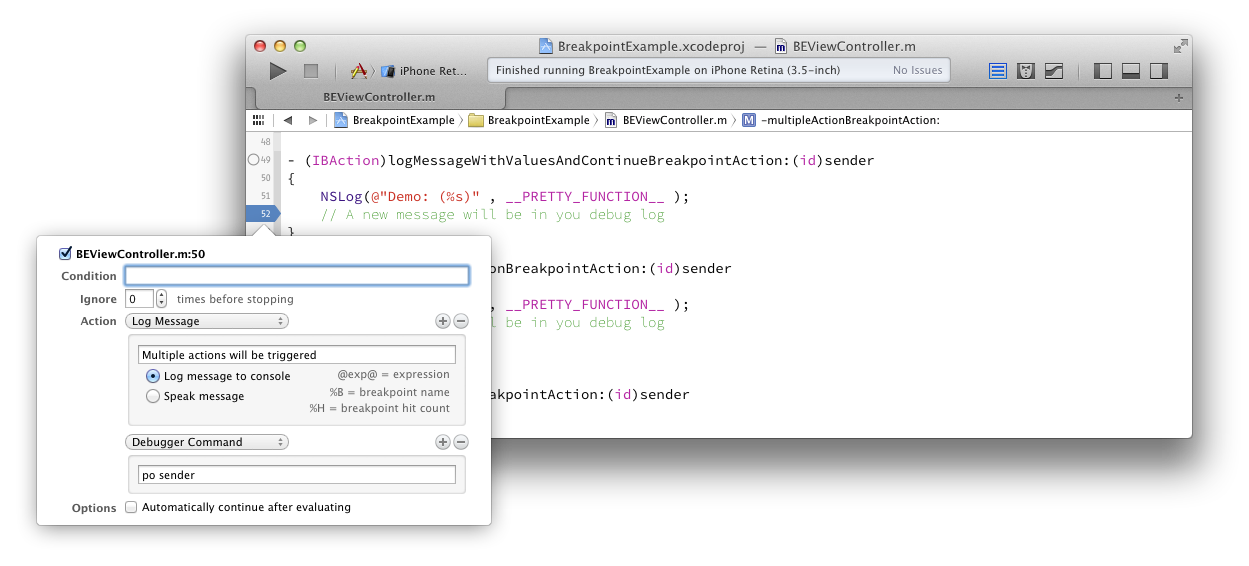
Like the previous example of logging in a breakpoint, this breakpoint logs a simple message but then uses a second action to run a Debugger Command action (which logs the description of the sender object). These Debugger Command commands would be the same sort of commands you would enter in the Debugger Console directly when stopped at a breakpoint.
More Multiple Action Breakpoints
Tap the “Multiple Action Breakpoint” button in the demo iOS app and Xcode will evaluate the breakpoint in themultipleActionBreakpointAction: selector:
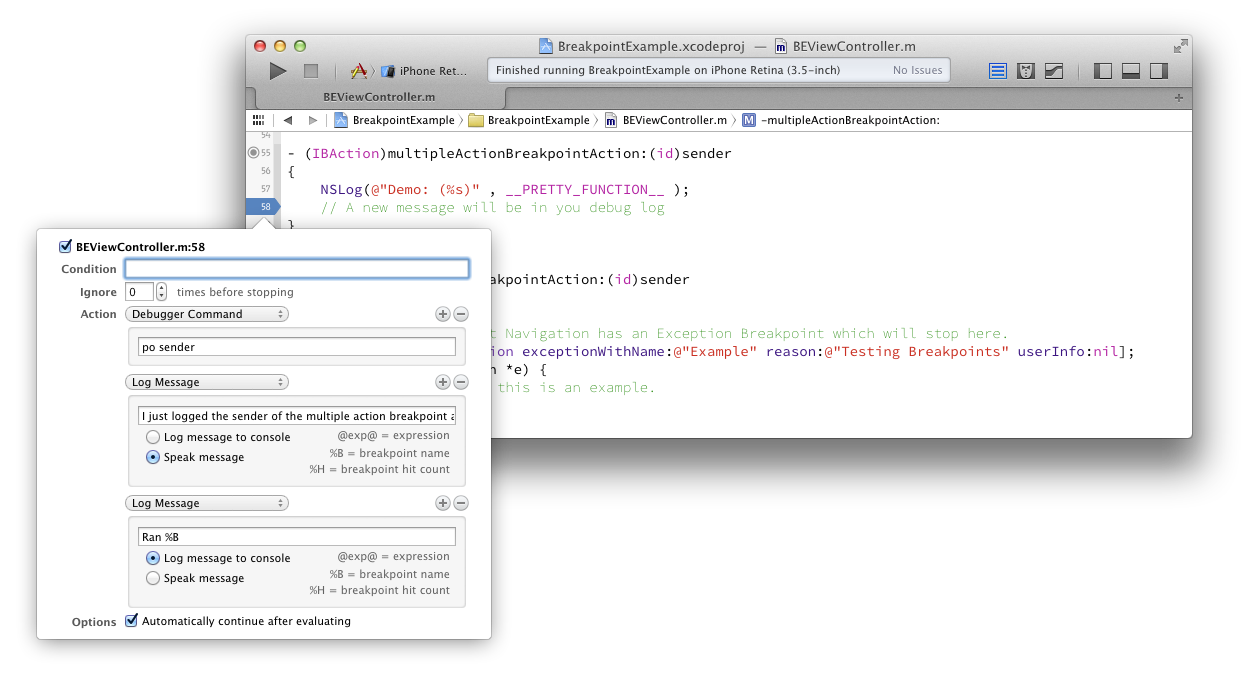
This breakpoint is just another example of using multiple actions at the same time in a breakpoint.
Exception Breakpoints
So far, all the breakpoints you’ve tried have been configured by clicking and creating the breakpoint on the line number of the code. There are a few other types of breakpoints that you can set up when you don’t have direct access to the implementation files of the code. For example, when an exception is thrown.
To create an exception breakpoint, click the + icon in the bottom left corner of the Breakpoint Navigator and select “Add Exception Breakpoint…”. This will give you some options such as which exceptions to stop at, where to stop, and again, additional actions you’d like to perform.
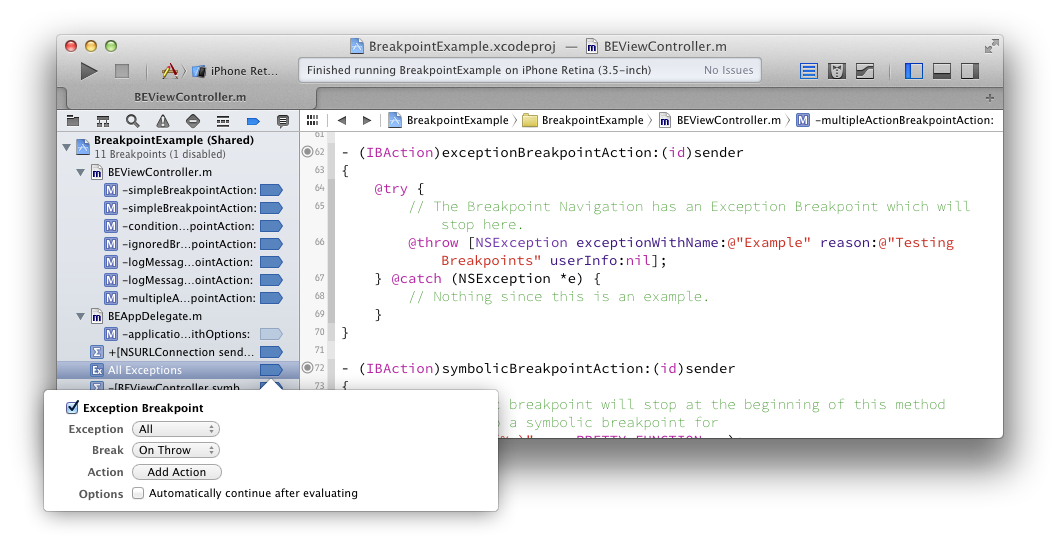
Tap the “Exception Breakpoint” button in the demo iOS app and Xcode will stop in the exceptionBreakpointAction: selector shown here:
- (IBAction)exceptionBreakpointAction:(id)sender{ @try { // The Breakpoint Navigation has an Exception Breakpoint which will stop here. @throw [NSException exceptionWithName:@"Example" reason:@"Testing Breakpoints" userInfo:nil]; } @catch (NSException *e) { // Nothing since this is an example. }}Now, for the purposes of the example, I’ve thrown an exception to demonstrate how the breakpoint will stop but this breakpoint will stop when any exception is thrown. This is a great debugging tool that you should probably always have on as it will immediately jump to problem spots. The only caveat is that it will still stop on exceptions that are handled gracefully so if you’re using frameworks that catch exceptions internally (such as Core Data) you may need to temporarily disable this until you need it.
I also recommend that you place these breakpoints in the userbreakpoint (right click and select “Move Breakpoint To > User”) so that they are shared across all your projects.
Symbolic Breakpoints
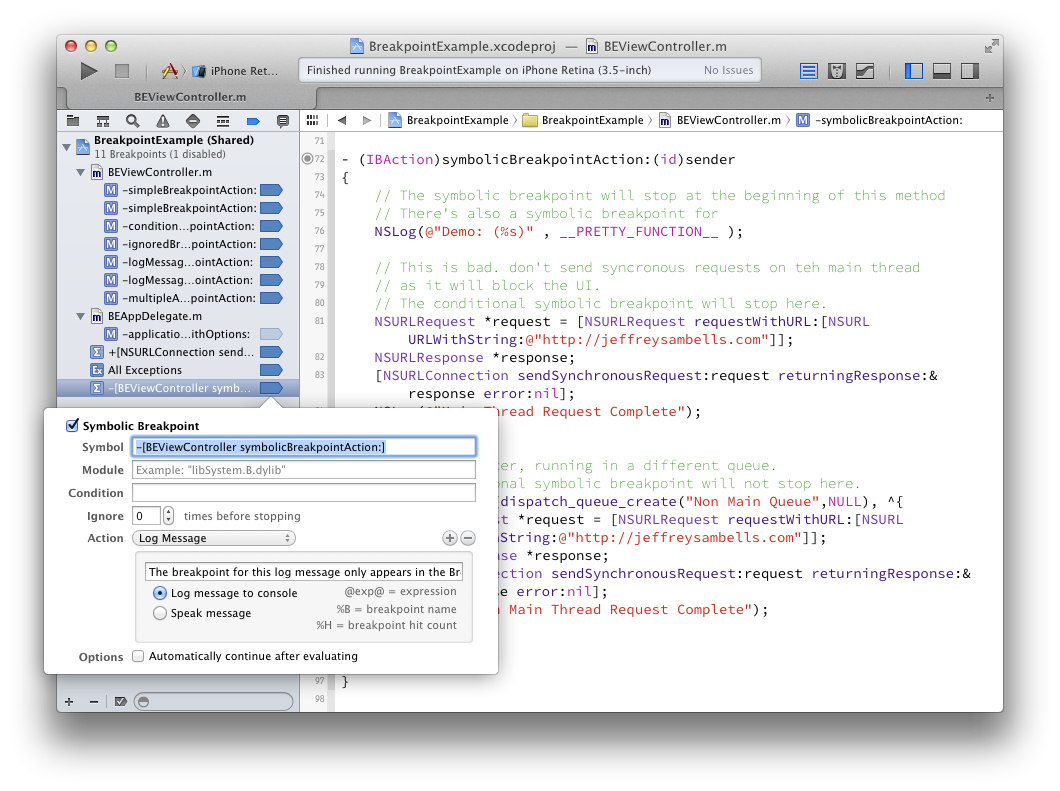
Symbolic breakpoints allow you to set breakpoints whenever specific selectors are sent messages. For example, here’s thesymbolicBreakpointAction: method in the demo app:
- (IBAction)symbolicBreakpointAction:(id)sender{ // The symbolic breakpoint will stop at the beginning of this method // There's also a symbolic breakpoint for NSLog(@"Demo: (%s)" , __PRETTY_FUNCTION__ ); // This is bad. don't send syncronous requests on the main thread // as it will block the UI. // The conditional symbolic breakpoint will stop here. NSURLRequest *request = [NSURLRequest requestWithURL:[NSURL URLWithString:@"http://jeffreysambells.com"]]; NSURLResponse *response; [NSURLConnection sendSynchronousRequest:request returningResponse:&response error:nil]; NSLog(@"Main Thread Request Complete"); // This is better, running in a different queue. // The conditional symbolic breakpoint will not stop here. dispatch_async(dispatch_queue_create("Non Main Queue",NULL), ^{ NSURLRequest *request = [NSURLRequest requestWithURL:[NSURL URLWithString:@"http://jeffreysambells.com"]]; NSURLResponse *response; [NSURLConnection sendSynchronousRequest:request returningResponse:&response error:nil]; NSLog(@"Non Main Thread Request Complete"); });}To pause execution whenever the your controller receives thesymbolicBreakpointAction: message you can add a symbolic breakpoint that specifies the appropriate class and selector (again using the + in the bottom corner of the Breakpoint Navigator):
Tap the “Symbolic Breakpoint” button in the demo iOS app and Xcode will stop in the symbolicBreakpointAction: selector using this symbolic breakpoint.
In this case, you have access to the implementation of the method so it would have been just as easy for you to click the line number to add the breakpoint. As an example, a much better use for this type of breakpoint would be to monitor for synchronous NSURLConnections that block the main thread (which is bad!).
If you take a look symbolicBreakpointAction: you’ll see there are two http requests, one on the main thread and one in a background queue. The Demo app also includes the following symbolic breakpoint which conditionally applies to [NSURLConnection sendSynchronousRequest:returningResponse:error:] but only if it’s on the main thread.
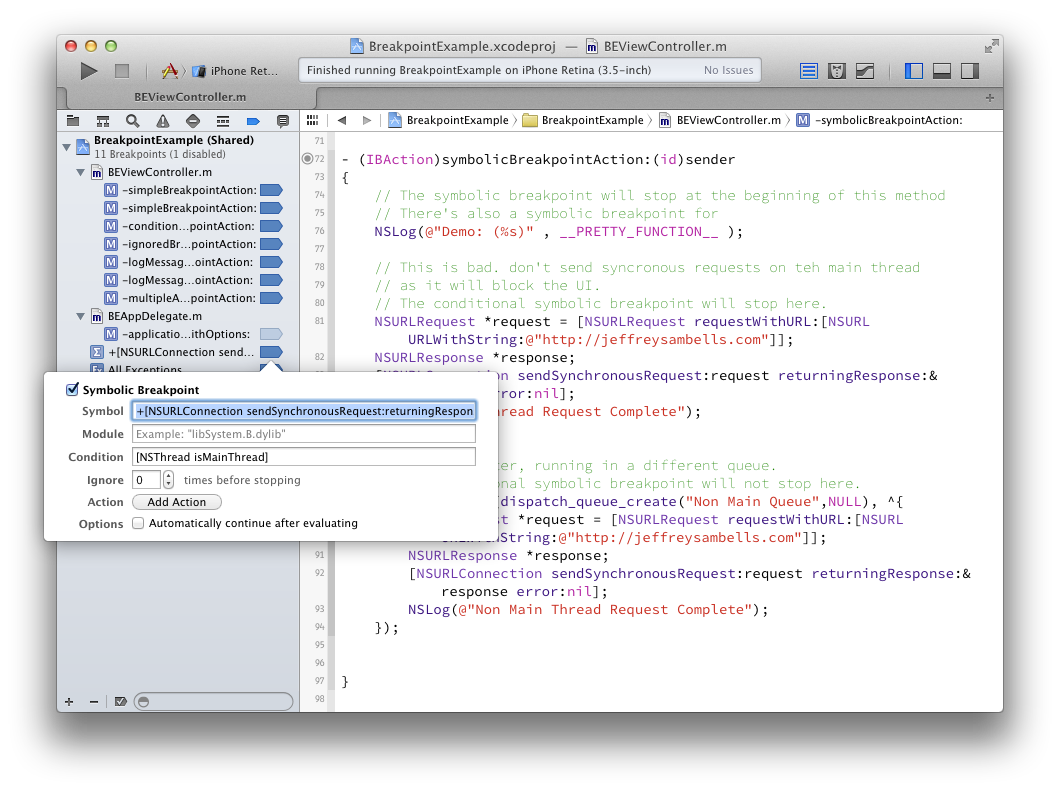
If you continue execution of the method past the previous symbolic breakpoint, you’ll notice that this symbolic breakpoint only stops in one case where the method runs on the main thread, and not where it runs in the background queue.
And a lot more fun
There’s a lot more you can do with scripting actions or even adding sounds to provide audible cues for your running code. If you come up with another creative idea, let me know and I’ll add it to this post.
For more information about how to inspect variables and the callstack at runtime see theApple Documentation ↩
This is a slight oversimplification as step over steps over the code within the same scope. You can also step into and out of other objects but step over is all you need for this example. ↩
- Using Breakpoints in Xcode
- Using GIT In Xcode
- Using OCLint in Xcode
- Tips for using Breakpoints
- Some tips in using Xcode
- Xcode – power of breakpoints
- Xcode – power of breakpoints
- Using openCV for Mac OS in XCode
- Using a static library in Xcode
- USING VECTOR IMAGES IN XCODE 6
- (Visual Studio) Part 3: Using Breakpoints Effectively
- BreakPoints
- Fixing breakpoints in native Android code
- Messages BreakPoints in 64dbg(翻译)
- ignoring UserInterfaceState.xcuserstate and Breakpoints_v2.xcbkptlist in Xcode, using SVN
- Working with UITableView in Xcode 5 Using Storyboard
- Using Open Source Static Libraries in Xcode 4
- How do I set breakpoints in modal dialogs?
- getcwd: cannot access parent directories的解决方法
- 有道词典的简单实现
- [其他] 认证与会话管理
- 下载文件,ie文件名乱码问题
- static 在C/C++中的用法总结
- Using Breakpoints in Xcode
- 走进Linux02-网络配置
- UEditor 1.4.2+版本文件图片上传路径配置
- poj2836
- JAVA中是先有对象还是先有类?
- android中工具方法和工具类收集
- DevExpress的DateEdit设置显示日期和时间
- lsof命令--列出当前系统打开文件
- Office Tips 2 - 如何备份oracle sql developer的connection