ros用rqt_graph显示节点关系、rqt_plot显示数据流、rqt_console显示节点的输出、rqt_logger_level
来源:互联网 发布:淘宝代发怎么发货 编辑:程序博客网 时间:2024/06/07 02:48
Using rqt_graph
rqt_graph creates a dynamic graph of what's going on in the system. rqt_graph is part of therqt package. Unless you already have it installed, run:
$ sudo apt-get install ros-<distro>-rqt$ sudo apt-get install ros-<distro>-rqt-common-plugins
replacing <distro> with the name of your ROS distribution (fuerte, groovy, etc.)
In a new terminal:
$ rosrun rqt_graph rqt_graphUsing rqt_plot
Note: If you're using electric or earlier, rqt is not available. Use rxplot instead.
rqt_plot displays a scrolling time plot of the data published on topics. Here we'll use rqt_plot to plot the data being published on the /turtle1/pose topic. First, start rqt_plot by typing
$ rosrun rqt_plot rqt_plotin a new terminal. In the new window that should pop up, a text box in the upper left corner gives you the ability to add any topic to the plot. Typing /turtle1/pose/x will highlight the plus button, previously disabled. Press it and repeat the same procedure with the topic /turtle1/pose/y. You will now see the turtle's x-y location plotted in the graph.
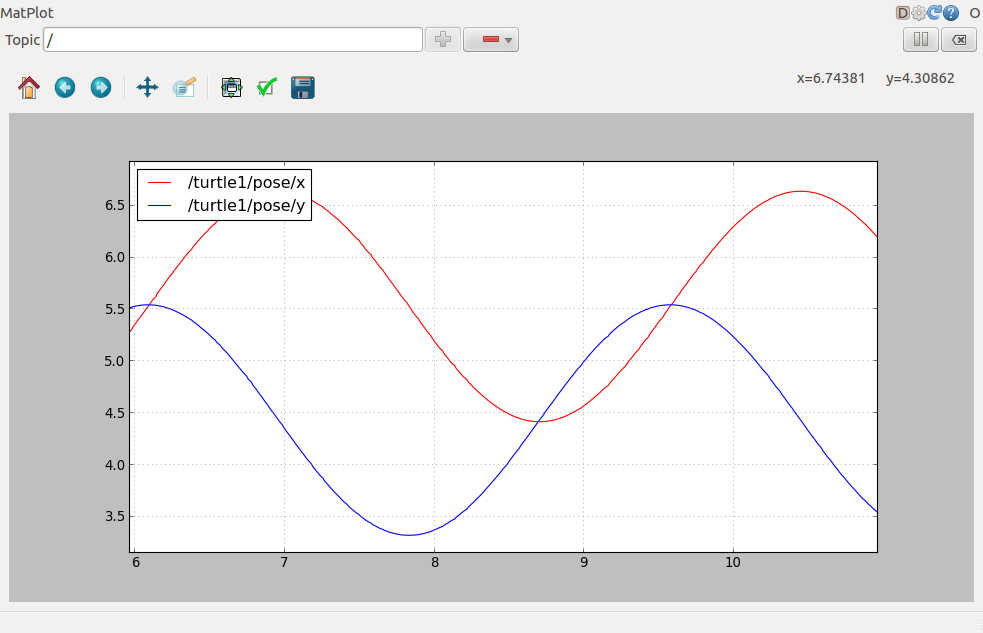
Pressing the minus button shows a menu that allows you to hide the specified topic from the plot. Hiding both the topics you just added and adding /turtle1/pose/theta will result in the plot shown in the next figure.
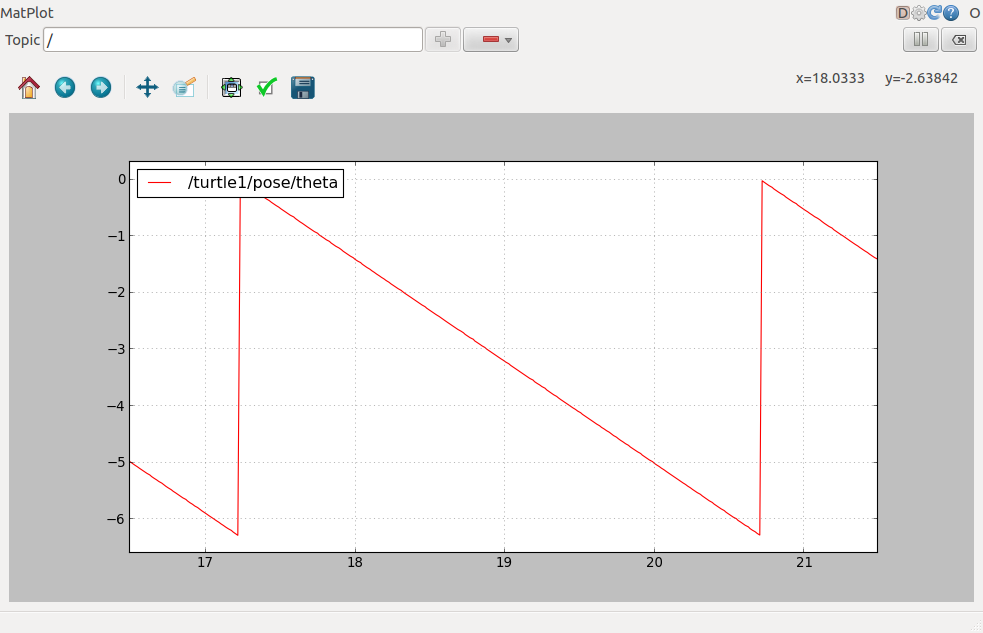
That's it for this section, use Ctrl-C to kill the rostopic terminals but keep your turtlesim running.
Now that you understand how ROS topics work, let's look at how services and parameters work.
http://wiki.ros.org/ROS/Tutorials/UnderstandingTopics
Using rqt_console and rqt_logger_level
rqt_console attaches to ROS's logging framework to display output from nodes. rqt_logger_level allows us to change the verbosity level (DEBUG, WARN, INFO, and ERROR) of nodes as they run.
Now let's look at the turtlesim output in rqt_console and switch logger levels in rqt_logger_level as we use turtlesim. Before we start the turtlesim, in two new terminals start rqt_console and rqt_logger_level:
$ rosrun rqt_console rqt_console
$ rosrun rqt_logger_level rqt_logger_levelYou will see two windows popup:
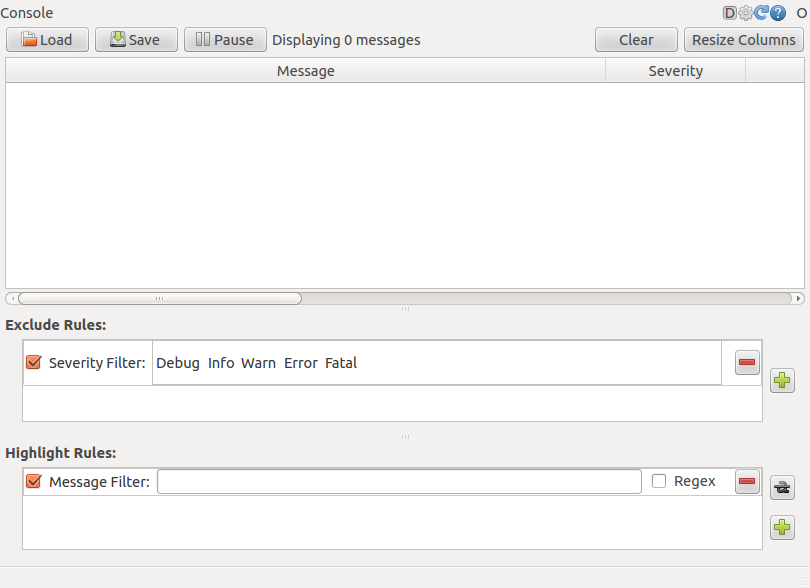

Now let's start turtlesim in a new terminal:
$ rosrun turtlesim turtlesim_nodeSince the default logger level is INFO you will see any info that the turtlesim publishes when it starts up, which should look like:
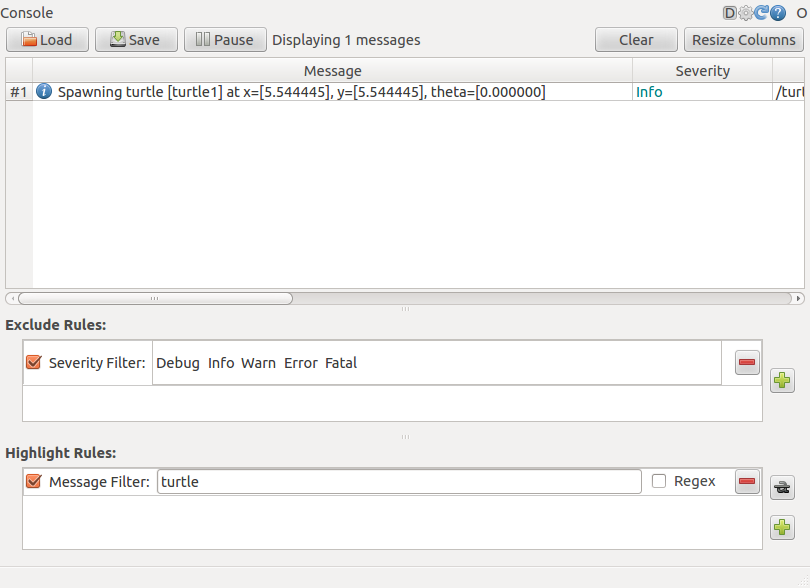
Now let's change the logger level to Warn by refreshing the nodes in the rqt_logger_level window and selecting Warn as shown below:

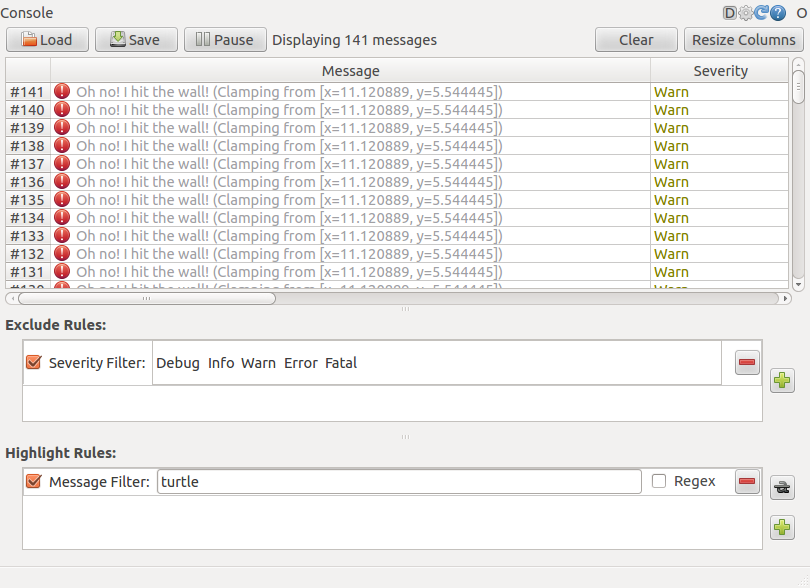
Now let's run our turtle into the wall and see what is displayed in our rqt_console:
For ROS Hydro and later,
rostopic pub /turtle1/cmd_vel geometry_msgs/Twist -r 1 -- '{linear: {x: 2.0, y: 0.0, z: 0.0}, angular: {x: 0.0,y: 0.0,z: 0.0}}'
Note: If you're using electric or earlier, rqt is not available. Use rxplot instead.
rqt_plot displays a scrolling time plot of the data published on topics. Here we'll use rqt_plot to plot the data being published on the /turtle1/pose topic. First, start rqt_plot by typing
$ rosrun rqt_plot rqt_plotin a new terminal. In the new window that should pop up, a text box in the upper left corner gives you the ability to add any topic to the plot. Typing /turtle1/pose/x will highlight the plus button, previously disabled. Press it and repeat the same procedure with the topic /turtle1/pose/y. You will now see the turtle's x-y location plotted in the graph.

Pressing the minus button shows a menu that allows you to hide the specified topic from the plot. Hiding both the topics you just added and adding /turtle1/pose/theta will result in the plot shown in the next figure.

That's it for this section, use Ctrl-C to kill the rostopic terminals but keep your turtlesim running.
Now that you understand how ROS topics work, let's look at how services and parameters work.http://wiki.ros.org/ROS/Tutorials/UnderstandingTopics
Using rqt_console and rqt_logger_level
rqt_console attaches to ROS's logging framework to display output from nodes. rqt_logger_level allows us to change the verbosity level (DEBUG, WARN, INFO, and ERROR) of nodes as they run.
Now let's look at the turtlesim output in rqt_console and switch logger levels in rqt_logger_level as we use turtlesim. Before we start the turtlesim, in two new terminals start rqt_console and rqt_logger_level:
$ rosrun rqt_console rqt_console$ rosrun rqt_logger_level rqt_logger_levelYou will see two windows popup:


Now let's start turtlesim in a new terminal:
$ rosrun turtlesim turtlesim_nodeSince the default logger level is INFO you will see any info that the turtlesim publishes when it starts up, which should look like:

Now let's change the logger level to Warn by refreshing the nodes in the rqt_logger_level window and selecting Warn as shown below:

Now let's run our turtle into the wall and see what is displayed in our rqt_console:
For ROS Hydro and later,
rostopic pub /turtle1/cmd_vel geometry_msgs/Twist -r 1 -- '{linear: {x: 2.0, y: 0.0, z: 0.0}, angular: {x: 0.0,y: 0.0,z: 0.0}}'For ROS Groovy and earlier,
rostopic pub /turtle1/command_velocity turtlesim/Velocity -r 1 -- 2.0 0.0
- ros用rqt_graph显示节点关系、rqt_plot显示数据流、rqt_console显示节点的输出、rqt_logger_level
- OnlyText只显示节点
- ztree显示选中节点
- ROS学习第三弹(Services/Parameters rqt_console/rqt_logger_level/roslaunch)
- JQuery动态显示当前选中节点的父节点
- easyUI-Tree显示选中节点的所有父节点
- 如何给QTreeView的节点显示图标
- flex tree 显示子节点的个数
- 如何给QTreeView的节点显示图标
- osg控制节点的显示与否
- echarts鼠标覆盖高亮显示节点及关系名称
- setZOrder 调正节点显示顺序
- echart3.0 节点关系图,自定义提示。边上属性不显示的问题。
- 实现winform中的treeview控件部分节点显示checkbox,部分节点不显示checkbox的功能
- visjs关系图-双击折叠展开子节点(隐藏显示子节点)以及位置自定义
- ROS节点、消息、服务、主题的关系
- 笔记-谷歌Zxing二维码,用数据流输出到页面显示
- 二次开发的节点生成子系统树后不能显示
- 论安卓适配器中的观察者模式
- 91 View the Exhibit and examine the resource consumption details for the current plan in use by the
- window下tomcat打印catalina.out问题
- 菜鸟学Java----继承
- 学习笔记栈
- ros用rqt_graph显示节点关系、rqt_plot显示数据流、rqt_console显示节点的输出、rqt_logger_level
- Nginx学习
- 排序 -- 思路简析(一)
- 啊违法
- 排序 -- 思路简析(二)
- shell 基础 第二部分 ( cut ,sort, wc,uniq,tee ,tr)
- 第七节 独立按键之中断方式
- Label转成URL
- 四阶幻方的穷举求解.


