绘图常见设置
来源:互联网 发布:mac哪款粉底液好用 编辑:程序博客网 时间:2024/05/15 20:19
说明:此贴会不定期进行更新!
设置1:图像的大小设置。
如果已经存在figure对象,可以通过以下代码设置尺寸大小:
f.set_figheight(15)f.set_figwidth(15)若果通过.sublots()命令来创建新的figure对象, 可以通过设置figsize参数达到目的。
f, axs = plt.subplots(2,2,figsize=(15,15))设置2:刻度和标注特殊设置
描述如下:在X轴标出一些重要的刻度点,当然实现方式有两种:直接在X轴上标注和通过注释annotate的形式标注在合适的位置。
其中第一种的实现并不是很合适,此处为了学习的目的一并说明下。
先说第一种:
正常X轴标注不会是这样的,为了说明此问题特意标注成这样,如此看来 0.3 和 0.4的标注重叠了,当然了解决重叠的问题可以通过改变figure 的size实现,显然此处并不想这样做。
怎么解决呢,那就在 0.3 和 0.4之间再设置一个刻度,有了空间后不显示即可。
代码如下:
# -*- coding: utf-8 -*-import matplotlib.pyplot as pltfig = plt.figure(figsize=(3, 3)) ax = fig.add_subplot(1, 1, 1, frameon=False)ax.set_xlim(-0.015, 1.515)ax.set_ylim(-0.01, 1.01)ax.set_xticks([0, 0.3, 0.4, 1.0, 1.5])#增加0.35处的刻度并不标注文本,然后重新标注0.3和0.4处文本ax.set_xticklabels([0.0, "", "", 1.0, 1.5])ax.set_xticks([0.35], minor=True)ax.set_xticklabels(["0.3 0.4"], minor=True)#上述设置只是增加空间,并不想看到刻度的标注,因此次刻度线不予显示。for line in ax.xaxis.get_minorticklines():line.set_visible(False)ax.grid(True)plt.show()最终图像形式如下:
当然最合理的方式是采用注释的形式,比如:
代码如下:
# -*- coding: utf-8 -*-import matplotlib.pyplot as pltimport numpy as np# Plot a sinc functiondelta=2.0x=np.linspace(-10,10,100)y=np.sinc(x-delta)# Mark deltaplt.axvline(delta,ls="--",color="r")plt.annotate(r"$\delta$",xy=(delta+0.2,-0.2),color="r",size=15)plt.plot(x,y)设置3:增加X轴与Y轴间的间隔,向右移动X轴标注一点点即可
显示效果对比:
设置前:
设置后:
两张的图像的差别很明显,代码如下:
# -*- coding: utf-8 -*-import matplotlib.pyplot as pltfig = plt.figure()ax = fig.add_subplot(111)plot_data=[1.7,1.7,1.7,1.54,1.52]xdata = range(len(plot_data))labels = ["2009-June","2009-Dec","2010-June","2010-Dec","2011-June"]ax.plot(xdata,plot_data,"b-")ax.set_xticks(range(len(labels)))ax.set_xticklabels(labels)ax.set_yticks([1.4,1.6,1.8])# grow the y axis down by 0.05ax.set_ylim(1.35, 1.8)# expand the x axis by 0.5 at two endsax.set_xlim(-0.5, len(labels)-0.5)plt.show()设置4:移动刻度标注
上图说明需求:
通过设置 set_horizontalalignment()来控制标注的左右位置:
for tick in ax2.xaxis.get_majorticklabels(): tick.set_horizontalalignment("left")当然标注文本的上下位置也是可以控制的,比如:
ax2.xaxis.get_majorticklabels()[2].set_y(-.1)当然控制刻度标注的上下位置也可以用labelpad参数进行设置:
pl.xlabel("...", labelpad=20) 或:
ax.xaxis.labelpad = 20具体设置请查阅官方文档,完整的代码如下:
# -*- coding: utf-8 -*-import matplotlib.pyplot as pltimport numpy as npimport datetime# my fake datadates = np.array([datetime.datetime(2000,1,1) + datetime.timedelta(days=i) for i in range(365*5)])data = np.sin(np.arange(365*5)/365.0*2*np.pi - 0.25*np.pi) + np.random.rand(365*5) /3# creates fig with 2 subplotsfig = plt.figure(figsize=(10.0, 6.0))ax = plt.subplot2grid((2,1), (0, 0))ax2 = plt.subplot2grid((2,1), (1, 0))## plot datesax2.plot_date( dates, data )# rotates labels plt.setp( ax2.xaxis.get_majorticklabels(), rotation=-45 ) # shift labels to the rightfor tick in ax2.xaxis.get_majorticklabels(): tick.set_horizontalalignment("right")plt.tight_layout()plt.show()设置5:调整图像边缘及图像间的空白间隔
图像外部边缘的调整可以使用plt.tight_layout()进行自动控制,此方法不能够很好的控制图像间的间隔。
如果想同时控制图像外侧边缘以及图像间的空白区域,使用命令:
plt.subplots_adjust(left=0.2, bottom=0.2, right=0.8, top=0.8,hspace=0.2, wspace=0.3)设置6:子图像统一标题设置。
效果如下(subplot row i):
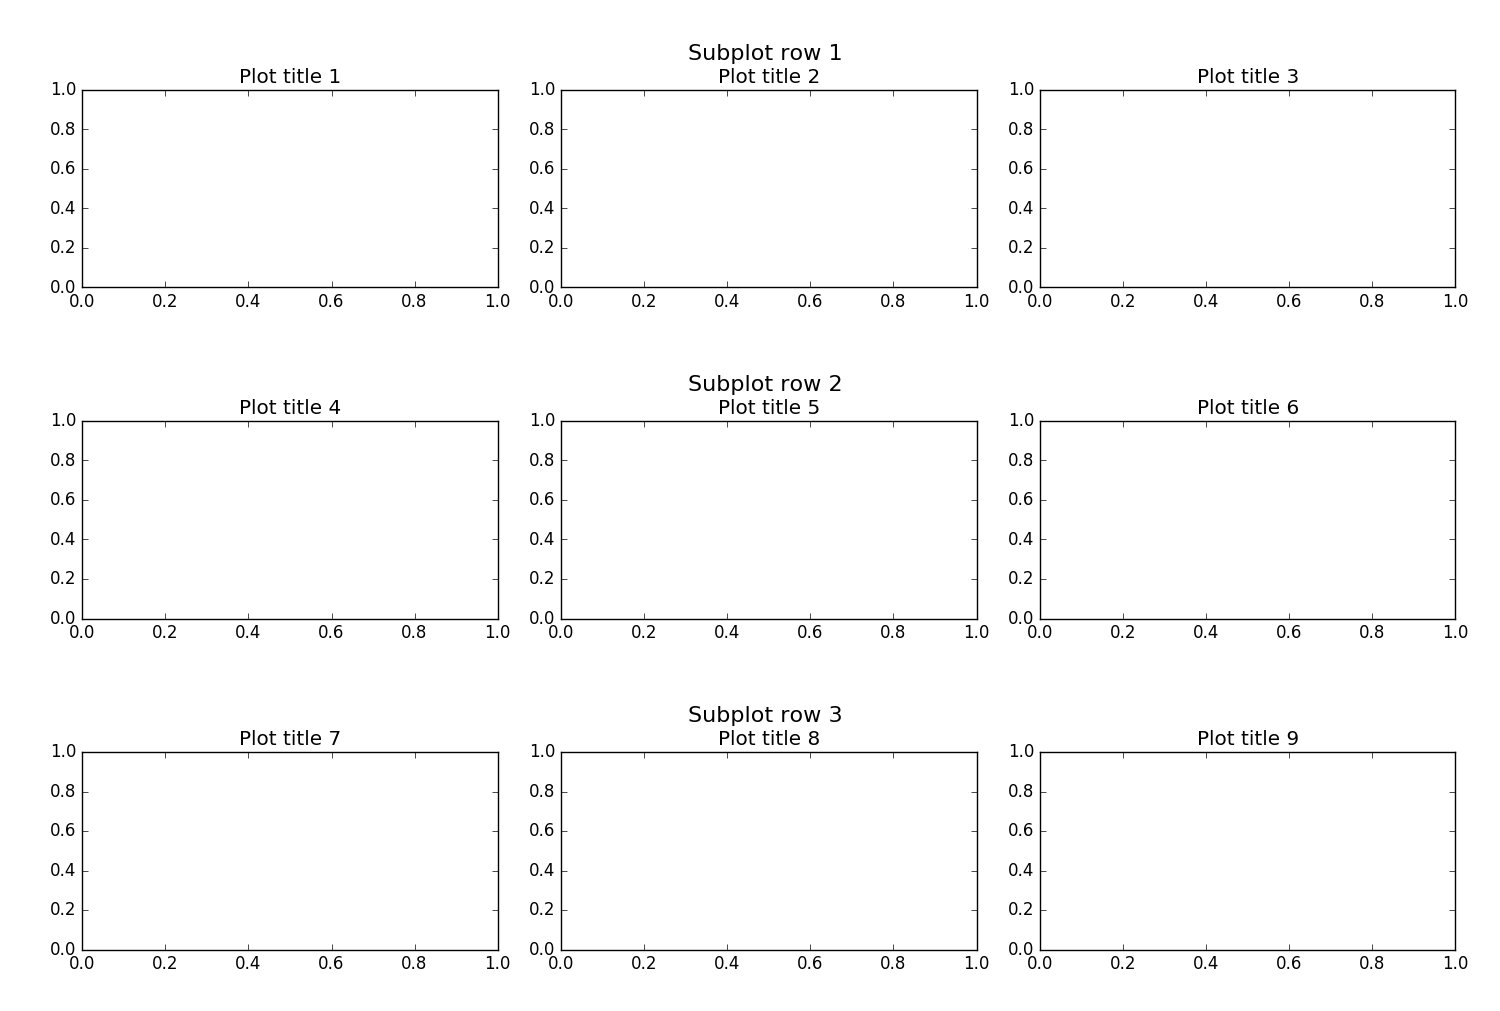
思路其实创建整个的子图像,然后将图像的刻度、标注等部分作不显示设置,仅仅显示图像的 title。
代码如下:
import matplotlib.pyplot as pltfig, big_axes = plt.subplots(figsize=(15.0, 15.0) , nrows=3, ncols=1, sharey=True) for row, big_ax in enumerate(big_axes, start=1): big_ax.set_title("Subplot row %s \n" % row, fontsize=16) # Turn off axis lines and ticks of the big subplot # obs alpha is 0 in RGBA string! big_ax.tick_params(labelcolor=(0,0,0,0), top='off', bottom='off', left='off', right='off') # removes the white frame big_ax._frameon = Falsefor i in range(1,10): ax = fig.add_subplot(3,3,i) ax.set_title('Plot title ' + str(i))fig.set_facecolor('w')plt.tight_layout()plt.show() 设置7:图像中标记线和区域的绘制
效果如下:
代码如下:
import numpy as npimport matplotlib.pyplot as pltt = np.arange(-1, 2, .01)s = np.sin(2*np.pi*t)plt.plot(t, s)# draw a thick red hline at y=0 that spans the xrangel = plt.axhline(linewidth=4, color='r')# draw a default hline at y=1 that spans the xrangel = plt.axhline(y=1)# draw a default vline at x=1 that spans the yrangel = plt.axvline(x=1)# draw a thick blue vline at x=0 that spans the upper quadrant of# the yrangel = plt.axvline(x=0, ymin=0.75, linewidth=4, color='b')# draw a default hline at y=.5 that spans the middle half of# the axesl = plt.axhline(y=.5, xmin=0.25, xmax=0.75)p = plt.axhspan(0.25, 0.75, facecolor='0.5', alpha=0.5)p = plt.axvspan(1.25, 1.55, facecolor='g', alpha=0.5)plt.axis([-1, 2, -1, 2])plt.show()参考:
- http://stackoverflow.com/questions/16162514/how-can-i-move-a-tick-label-onlywithout-moving-corresponding-tick
- http://stackoverflow.com/questions/28615887/how-to-move-a-ticks-label-in-matplotlib
- http://stackoverflow.com/questions/31928209/matplotlib-fixed-spacing-between-left-edge-of-figure-and-y-axis
- http://stackoverflow.com/questions/6406368/matplotlib-move-x-axis-label-downwards-but-not-x-axis-ticks
- http://matplotlib.org/examples/pylab_examples/axhspan_demo.html
0 0
- 绘图常见设置
- Matlab绘图设置
- SetROP2设置绘图模式
- matlab绘图设置
- AutoCad 设置绘图环境
- MFC绘图6--设置绘图模式
- 设置GC绘图的透明度
- GC绘图:设置笔画信息
- Matlab绘图坐标轴的设置
- 后台绘图设置背景透明
- matlab绘图坐标属性设置
- Extjs常见的几种绘图实现
- MATLAB 绘图之 设置绘图属性(持续更新中)
- 一些常见安全设置
- Eclipse软件常见设置
- 几个常见Windows设置
- DZ常见设置
- QT 常见设置
- 解决tomcat服务器跨域请求问题
- Apache 目录权限设置方法
- Tomcat的URL中文乱码解决以及传输优化
- Java实现将图片上传至服务器(FTP协议)
- 学习计划
- 绘图常见设置
- PPPOE服务器+客户端
- 51nod-【1106 质数检测】
- 玩转Android Material Design包
- 润乾报表v4-struts2集成(包括遇到问题)
- 斯坦福CS231n - CNN for Visual Recognition(7)-lecture6梯度检查、参数更新
- 继承自View的自定义控件的warp_content和padding属性处理
- spark集群上如何配置深度学习elephas框架的操作流程(shell版)
- 查询域名MX、A、DNS、txt、cname记录是否生效