杂记
来源:互联网 发布:html5 modernizer.js 编辑:程序博客网 时间:2024/04/26 14:54
自然邻点插值法:
广泛应用于一些研究领域中。其基本原理是对于一组泰森(Thiessen)多边形,当在数据集中加入一个新的数据点(目标)时,就会修改这些泰森多边形,而使用邻点的权重平均值将决定待插点的权重, 待插点的权重和目标泰森多边形成比例。实际上,在这些多边形中,有一些多边形的尺寸将缩小,并且没有一个多边形的大小会增加。同时,自然邻点插值法在数据点凸起的位置并不外推等值线(如泰森多边形的轮廓线)。\
numpy.linspace使用详解
numpy.linspace(start, stop, num=50, endpoint=True, retstep=False, dtype=None)
在指定的间隔内返回均匀间隔的数字。
返回num均匀分布的样本,在[start, stop]。
这个区间的端点可以任意的被排除在外。
start : scalar(标量)
The starting value of the sequence(序列的起始点).
stop : scalar
序列的结束点,除非endpoint被设置为False,在这种情况下, the sequence consists of all but the last of num + 1 evenly spaced samples(该序列包括所有除了最后的num+1上均匀分布的样本(感觉这样翻译有点坑)), 以致于stop被排除.当endpoint is False的时候注意步长的大小(下面有例子).
num : int, optional(可选)
生成的样本数,默认是50。必须是非负。
endpoint : bool, optional
如果是真,则一定包括stop,如果为False,一定不会有stop
retstep : bool, optional
If True, return (samples, step), where step is the spacing between samples.(看例子)
dtype : dtype, optional
The type of the output array. If dtype is not given, infer the data type from the other input arguments(推断这个输入用例从其他的输入中).
New in version 1.9.0.
samples : ndarray
There are num equally spaced samples in the closed interval [start, stop] or the half-open interval [start, stop) (depending on whether endpoint is True or False).
step : float(只有当retstep设置为真的时候才会存在)
Only returned if retstep is True
Size of spacing between samples.
See also
- arange
- Similar to linspace, but uses a step size (instead of the number of samples).
- arange使用的是步长,而不是样本的数量
- logspace
- Samples uniformly distributed in log space.
>>> np.linspace(1, 10, 10)
array([ 1., 2., 3., 4., 5., 6., 7., 8., 9., 10.])
>>> np.linspace(1, 10, 10, endpoint = False)
array([ 1. , 1.9, 2.8, 3.7, 4.6, 5.5, 6.4, 7.3, 8.2, 9.1])
Out[4]: (array([ 1. , 1.9, 2.8, 3.7, 4.6, 5.5, 6.4, 7.3, 8.2, 9.1]), 0.9)
官网的例子
Examples
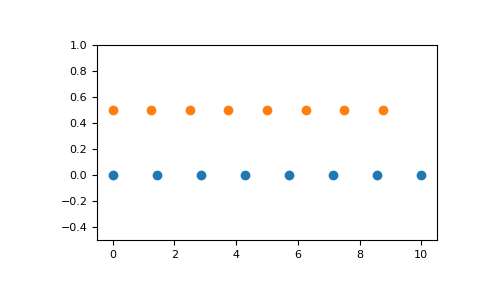
>>> np.linspace(2.0, 3.0, num=5) array([ 2. , 2.25, 2.5 , 2.75, 3. ])>>> np.linspace(2.0, 3.0, num=5, endpoint=False) array([ 2. , 2.2, 2.4, 2.6, 2.8])>>> np.linspace(2.0, 3.0, num=5, retstep=True) (array([ 2. , 2.25, 2.5 , 2.75, 3. ]), 0.25)Graphical illustration:
>>> import matplotlib.pyplot as plt>>> N = 8>>> y = np.zeros(N)>>> x1 = np.linspace(0, 10, N, endpoint=True)>>> x2 = np.linspace(0, 10, N, endpoint=False)>>> plt.plot(x1, y, 'o')[<matplotlib.lines.Line2D object at 0x...>]>>> plt.plot(x2, y + 0.5, 'o')[<matplotlib.lines.Line2D object at 0x...>]>>> plt.ylim([-0.5, 1])(-0.5, 1)>>> plt.show()