python中做层次聚类,使用scipy.cluster.hierarchy.fclusterdata方法
来源:互联网 发布:协同过滤算法实现 编辑:程序博客网 时间:2024/06/07 03:24
python机器学习包里面的cluster提供了很多聚类算法,其中ward_tree实现了凝聚层次聚类算法。
但是没有看明白ward_tree的返回值代表了什么含义,遂决定寻找别的实现方式。
经过查找,发现scipy.cluster.hierarchy.fclusterdata能够实现层次聚类。有关这个方法的介绍在:http://docs.scipy.org/doc/scipy/reference/generated/scipy.cluster.hierarchy.fclusterdata.html
以下是具体的python代码
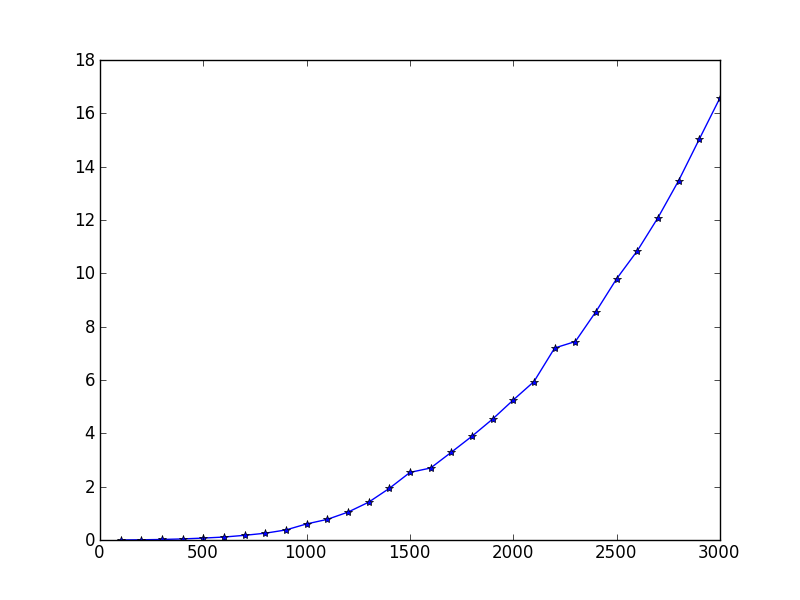
#coding=utf8"""# Author: waleking# Created Time : 四 7/26 17:05:07 2012 Last Modified: 二 7/31 17:56:26 2012# File Name: hierachical.py# Description:使用sklearn的层次聚类方法,具体的是ward_tree方法测试数据采用iris数据,sklearn.datasets.load_iris()但是发现sklearn.cluster.ward_tree方法没有看懂,实验stackoverflow里面的代码http://stackoverflow.com/questions/9873840/cant-get-scipy-hierarchical-clustering-to-work"""import sklearn.datasets as datasetsimport scipy.cluster.hierarchy as hclusterimport numpy.random as randomimport numpy as npimport numpy.core.fromnumericimport timeimport matplotlib.pyplot as pltdef irisSample():iris=datasets.load_iris()irisdata=iris.dataresult=hcluster.fclusterdata(irisdata, criterion='maxclust',t=3)print("result is %s" % result)def gaussianSample():timeCheckin=time.clock()X=random.randn(100,100)X[:50,:100]+=10result=hcluster.fclusterdata(X, criterion='maxclust',t=2)print("hierachical clustering on sample with shape(%d,%d) cost %s seconds " % (np.shape(X)[0],np.shape(X)[1],time.clock()-timeCheckin))print("result is %s" % result)clusterA=[label for label in result if(label==1)]clusterB=[label for label in result if(label==2)]print("There are %d samples in cluster 1" %(len(clusterA)))print("ClusterA is %s" % clusterA)print("There are %d samples in cluster 2" %(len(clusterB)))print("ClusterB is %s" % clusterB)def testPerformanceByNum(start,end,increment):"""测试样本数对性能的影响"""mapPerformance=dict()for sampleNum in range(start,end,increment):X=random.randn(sampleNum,100)X[:50,:100]+=10timeCheckin=time.clock()result=hcluster.fclusterdata(X,criterion='maxclust',t=2)timeCost=time.clock()-timeCheckinmapPerformance[sampleNum]=timeCostreturn mapPerformancedef testPerformanceByDim(start,end,increment):"""测试维度对性能的影响"""mapPerformance=dict()for dim in range(start,end,increment):X=random.randn(100,dim)X[:50,:dim]+=10timeCheckin=time.clock()result=hcluster.fclusterdata(X,criterion='maxclust',t=2)timeCost=time.clock()-timeCheckinmapPerformance[dim]=timeCostreturn mapPerformancedef showPerformance(mapPerformance):"""画图,展现性能"""xAxisData=numpy.core.fromnumeric.sort(mapPerformance.keys())yAxisData=[mapPerformance[key] for key in xAxisData]plt.plot(xAxisData,yAxisData,'*-')plt.show()#irisSample()#gaussianSample()mapPerformance=testPerformanceByNum(100,3100,100)showPerformance(mapPerformance)mapPerformance=testPerformanceByDim(100,10100,100)showPerformance(mapPerformance)我们测试了100维的数据的层次聚类,随机生成100个到3000个服从高斯分布的数据,让50个点的均值不同于其余的点。
测试的性能图如下:

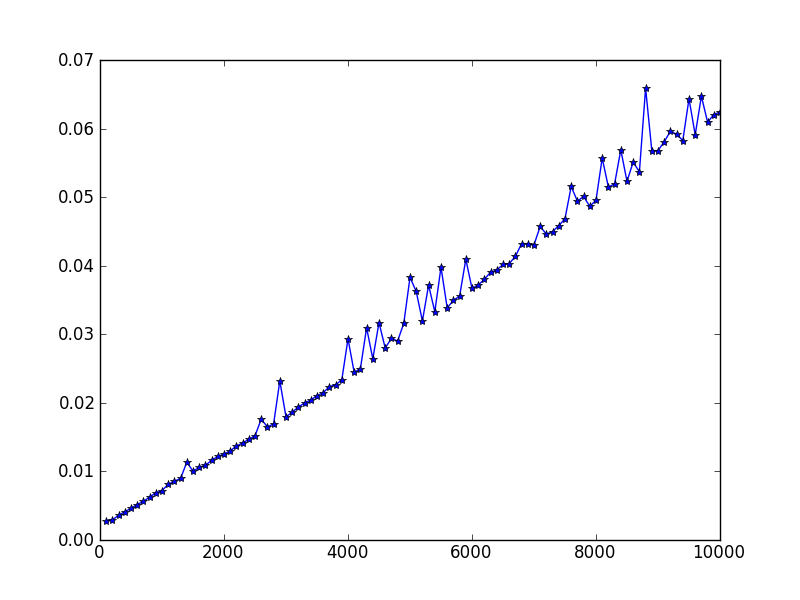
我们又测试了固定样本数:100个样本,服从高斯分布,其中50个的均值不同于另外的50个。我们实验了维度从100变化到10000,得到性能图如下:

结论:层次聚类的时间复杂度是O(m^2 n),和Andrew Ng在机器学习课程中的符号相同,其中样本数是m,维度是n,
- python中做层次聚类,使用scipy.cluster.hierarchy.fclusterdata方法
- python中做层次聚类,使用scipy.cluster.hierarchy.fclusterdata方法
- Python聚类工具scipy cluster
- python模块之scipy的层次聚类简单测试与使用
- 使用scipy进行层次聚类和k-means聚类
- 使用scipy进行层次聚类和k-means聚类
- Hierarchical Cluster 层次聚类
- Hierarchical Cluster 层次聚类
- python做科学计算scipy
- 使用scipy进行聚类
- JRTPLIB:Class Hierarchy(类层次)翻译
- python层次聚类
- python spicy.hierarchy 实现聚类
- python进行聚类(scikit-lean、scipy)
- python进行聚类(scikit-lean、scipy)
- python做科学计算 numpy scipy matplotlib
- Python(22):用SciPy做优化
- 层次聚类方法
- 图解教你如何使用ANT打包java程序
- vim常用命令
- 数塔
- DP---矩阵连乘
- 关于spring定时器一次调用却触发了两次trigger的问题分析
- python中做层次聚类,使用scipy.cluster.hierarchy.fclusterdata方法
- A/Gb mode, lu mode
- PhantomJS 服务端渲染网页,记录各个请求信息
- html 图片底端对齐
- Struts2配置文件
- 重新安装apahce2 服务器
- 多态和重载
- DP---最长公共子序列
- ZOJ 3627 Treasure Hunt II


