Logistic Regression

来源:互联网 发布:centos 6.5 硬盘分区 编辑:程序博客网 时间:2024/06/03 22:55

Logistic Regression

Agenda

  1. Refresh your memory on how to do linear regression in scikit-learn
  2. Attempt to use linear regression for classification
  3. Show you why logistic regression is a better alternative for classification
  4. Brief overview of probability, odds, e, log, and log-odds
  5. Explain the form of logistic regression
  6. Explain how to interpret logistic regression coefficients
  7. Demonstrate how logistic regression works with categorical features
  8. Compare logistic regression with other models

Part 1: Predicting a Continuous Response

In [1]:
# glass identification datasetimport pandas as pdurl = 'http://archive.ics.uci.edu/ml/machine-learning-databases/glass/glass.data'col_names = ['id','ri','na','mg','al','si','k','ca','ba','fe','glass_type']glass = pd.read_csv(url, names=col_names, index_col='id')glass.sort('al', inplace=True)glass.head()
Out[1]:
 rinamgalsikcabafeglass_typeid          221.5196614.773.750.2972.020.039.0000.0011851.5111517.380.000.3475.410.006.6500.006401.5221314.213.820.4771.770.119.5700.001391.5221314.213.820.4771.770.119.5700.001511.5232013.723.720.5171.750.0910.0600.161

Question: Pretend that we want to predict ri, and our only feature is al. How could we do it using machine learning?

Answer: We could frame it as a regression problem, and use a linear regression model with al as the only feature and ri as the response.

Question: How would we visualize this model?

Answer: Create a scatter plot with al on the x-axis and ri on the y-axis, and draw the line of best fit.

In [2]:
import seaborn as snsimport matplotlib.pyplot as plt%matplotlib inlinesns.set(font_scale=1.5)
In [3]:
sns.lmplot(x='al', y='ri', data=glass, ci=None)
Out[3]:
<seaborn.axisgrid.FacetGrid at 0x4136358>

Question: How would we draw this plot without using Seaborn?

In [4]:
# scatter plot using Pandasglass.plot(kind='scatter', x='al', y='ri')
Out[4]:
<matplotlib.axes._subplots.AxesSubplot at 0x18395d30>
In [5]:
# equivalent scatter plot using Matplotlibplt.scatter(glass.al, glass.ri)plt.xlabel('al')plt.ylabel('ri')
Out[5]:
<matplotlib.text.Text at 0x187b42b0>
In [6]:
# fit a linear regression modelfrom sklearn.linear_model import LinearRegressionlinreg = LinearRegression()feature_cols = ['al']X = glass[feature_cols]y = glass.rilinreg.fit(X, y)
Out[6]:
LinearRegression(copy_X=True, fit_intercept=True, n_jobs=1, normalize=False)
In [7]:
# make predictions for all values of Xglass['ri_pred'] = linreg.predict(X)glass.head()
Out[7]:
 rinamgalsikcabafeglass_typeri_predid           221.5196614.773.750.2972.020.039.0000.0011.5212271851.5111517.380.000.3475.410.006.6500.0061.521103401.5221314.213.820.4771.770.119.5700.0011.520781391.5221314.213.820.4771.770.119.5700.0011.520781511.5232013.723.720.5171.750.0910.0600.1611.520682
In [8]:
# plot those predictions connected by a lineplt.plot(glass.al, glass.ri_pred, color='red')plt.xlabel('al')plt.ylabel('Predicted ri')
Out[8]:
<matplotlib.text.Text at 0x1a1fbda0>
In [9]:
# put the plots togetherplt.scatter(glass.al, glass.ri)plt.plot(glass.al, glass.ri_pred, color='red')plt.xlabel('al')plt.ylabel('ri')
Out[9]:
<matplotlib.text.Text at 0x1a21d7b8>

Refresher: interpreting linear regression coefficients

Linear regression equation: $y = \beta_0 + \beta_1x$

In [10]:
# compute prediction for al=2 using the equationlinreg.intercept_ + linreg.coef_ * 2
Out[10]:
array([ 1.51699012])
In [11]:
# compute prediction for al=2 using the predict methodlinreg.predict(2)
Out[11]:
array([ 1.51699012])
In [12]:
# examine coefficient for alzip(feature_cols, linreg.coef_)
Out[12]:
[('al', -0.002477606387469623)]

Interpretation: A 1 unit increase in 'al' is associated with a 0.0025 unit decrease in 'ri'.

In [13]:
# increasing al by 1 (so that al=3) decreases ri by 0.00251.51699012 - 0.0024776063874696243
Out[13]:
1.5145125136125304
In [14]:
# compute prediction for al=3 using the predict methodlinreg.predict(3)
Out[14]:
array([ 1.51451251])

Part 2: Predicting a Categorical Response

In [15]:
# examine glass_typeglass.glass_type.value_counts().sort_index()
Out[15]:
1    702    763    175    136     97    29dtype: int64
In [16]:
# types 1, 2, 3 are window glass# types 5, 6, 7 are household glassglass['household'] = glass.glass_type.map({1:0, 2:0, 3:0, 5:1, 6:1, 7:1})glass.head()
Out[16]:
 rinamgalsikcabafeglass_typeri_predhouseholdid            221.5196614.773.750.2972.020.039.0000.0011.52122701851.5111517.380.000.3475.410.006.6500.0061.5211031401.5221314.213.820.4771.770.119.5700.0011.5207810391.5221314.213.820.4771.770.119.5700.0011.5207810511.5232013.723.720.5171.750.0910.0600.1611.5206820

Let's change our task, so that we're predicting household using al. Let's visualize the relationship to figure out how to do this:

In [17]:
plt.scatter(glass.al, glass.household)plt.xlabel('al')plt.ylabel('household')
Out[17]:
<matplotlib.text.Text at 0x1a570cf8>

Let's draw a regression line, like we did before:

In [18]:
# fit a linear regression model and store the predictionsfeature_cols = ['al']X = glass[feature_cols]y = glass.householdlinreg.fit(X, y)glass['household_pred'] = linreg.predict(X)
In [19]:
# scatter plot that includes the regression lineplt.scatter(glass.al, glass.household)plt.plot(glass.al, glass.household_pred, color='red')plt.xlabel('al')plt.ylabel('household')
Out[19]:
<matplotlib.text.Text at 0x1a87ddd8>

If al=3, what class do we predict for household? 1

If al=1.5, what class do we predict for household? 0

We predict the 0 class for lower values of al, and the 1 class for higher values of al. What's our cutoff value? Around al=2, because that's where the linear regression line crosses the midpoint between predicting class 0 and class 1.

Therefore, we'll say that if household_pred >= 0.5, we predict a class of 1, else we predict a class of 0.

In [20]:
# understanding np.whereimport numpy as npnums = np.array([5, 15, 8])# np.where returns the first value if the condition is True, and the second value if the condition is Falsenp.where(nums > 10, 'big', 'small')
Out[20]:
array(['small', 'big', 'small'],       dtype='|S5')
In [21]:
# transform household_pred to 1 or 0glass['household_pred_class'] = np.where(glass.household_pred >= 0.5, 1, 0)glass.head()
Out[21]:
 rinamgalsikcabafeglass_typeri_predhouseholdhousehold_predhousehold_pred_classid              221.5196614.773.750.2972.020.039.0000.0011.5212270-0.34049501851.5111517.380.000.3475.410.006.6500.0061.5211031-0.3154360401.5221314.213.820.4771.770.119.5700.0011.5207810-0.2502830391.5221314.213.820.4771.770.119.5700.0011.5207810-0.2502830511.5232013.723.720.5171.750.0910.0600.1611.5206820-0.2302360
In [22]:
# plot the class predictionsplt.scatter(glass.al, glass.household)plt.plot(glass.al, glass.household_pred_class, color='red')plt.xlabel('al')plt.ylabel('household')
Out[22]:
<matplotlib.text.Text at 0x1a8af550>

Part 3: Using Logistic Regression Instead

Logistic regression can do what we just did:

In [23]:
# fit a logistic regression model and store the class predictionsfrom sklearn.linear_model import LogisticRegressionlogreg = LogisticRegression(C=1e9)feature_cols = ['al']X = glass[feature_cols]y = glass.householdlogreg.fit(X, y)glass['household_pred_class'] = logreg.predict(X)
In [24]:
# plot the class predictionsplt.scatter(glass.al, glass.household)plt.plot(glass.al, glass.household_pred_class, color='red')plt.xlabel('al')plt.ylabel('household')
Out[24]:
<matplotlib.text.Text at 0x1ace2080>

What if we wanted the predicted probabilities instead of just the class predictions, to understand how confident we are in a given prediction?

In [25]:
# store the predicted probabilites of class 1glass['household_pred_prob'] = logreg.predict_proba(X)[:, 1]
In [26]:
# plot the predicted probabilitiesplt.scatter(glass.al, glass.household)plt.plot(glass.al, glass.household_pred_prob, color='red')plt.xlabel('al')plt.ylabel('household')
Out[26]:
<matplotlib.text.Text at 0x1accc550>
In [27]:
# examine some example predictionsprint logreg.predict_proba(1)print logreg.predict_proba(2)print logreg.predict_proba(3)
[[ 0.97161726  0.02838274]][[ 0.34361555  0.65638445]][[ 0.00794192  0.99205808]]

The first column indicates the predicted probability of class 0, and the second column indicates the predicted probability of class 1.

Part 4: Probability, odds, e, log, log-odds

$$probability = \frac {one\ outcome} {all\ outcomes}$$$$odds = \frac {one\ outcome} {all\ other\ outcomes}$$

Examples:

  • Dice roll of 1: probability = 1/6, odds = 1/5
  • Even dice roll: probability = 3/6, odds = 3/3 = 1
  • Dice roll less than 5: probability = 4/6, odds = 4/2 = 2
$$odds = \frac {probability} {1 - probability}$$$$probability = \frac {odds} {1 + odds}$$
In [28]:
# create a table of probability versus oddstable = pd.DataFrame({'probability':[0.1, 0.2, 0.25, 0.5, 0.6, 0.8, 0.9]})table['odds'] = table.probability/(1 - table.probability)table
Out[28]:
 probabilityodds00.100.11111110.200.25000020.250.33333330.501.00000040.601.50000050.804.00000060.909.000000

What is e? It is the base rate of growth shared by all continually growing processes:

In [29]:
# exponential function: e^1np.exp(1)
Out[29]:
2.7182818284590451

What is a (natural) log? It gives you the time needed to reach a certain level of growth:

In [30]:
# time needed to grow 1 unit to 2.718 unitsnp.log(2.718)
Out[30]:
0.99989631572895199

It is also the inverse of the exponential function:

In [31]:
np.log(np.exp(5))
Out[31]:
5.0
In [32]:
# add log-odds to the tabletable['logodds'] = np.log(table.odds)table
Out[32]:
 probabilityoddslogodds00.100.111111-2.19722510.200.250000-1.38629420.250.333333-1.09861230.501.0000000.00000040.601.5000000.40546550.804.0000001.38629460.909.0000002.197225

Part 5: What is Logistic Regression?

Linear regression: continuous response is modeled as a linear combination of the features:

$$y = \beta_0 + \beta_1x$$

Logistic regression: log-odds of a categorical response being "true" (1) is modeled as a linear combination of the features:

$$\log \left({p\over 1-p}\right) = \beta_0 + \beta_1x$$

This is called the logit function.

Probability is sometimes written as pi:

$$\log \left({\pi\over 1-\pi}\right) = \beta_0 + \beta_1x$$

The equation can be rearranged into the logistic function:

$$\pi = \frac{e^{\beta_0 + \beta_1x}} {1 + e^{\beta_0 + \beta_1x}}$$

In other words:

  • Logistic regression outputs the probabilities of a specific class
  • Those probabilities can be converted into class predictions

The logistic function has some nice properties:

  • Takes on an "s" shape
  • Output is bounded by 0 and 1

We have covered how this works for binary classification problems (two response classes). But what about multi-class classification problems (more than two response classes)?

  • Most common solution for classification models is "one-vs-all" (also known as "one-vs-rest"): decompose the problem into multiple binary classification problems
  • Multinomial logistic regression can solve this as a single problem

Part 6: Interpreting Logistic Regression Coefficients

In [33]:
# plot the predicted probabilities againplt.scatter(glass.al, glass.household)plt.plot(glass.al, glass.household_pred_prob, color='red')plt.xlabel('al')plt.ylabel('household')
Out[33]:
<matplotlib.text.Text at 0x1b302a58>
In [34]:
# compute predicted log-odds for al=2 using the equationlogodds = logreg.intercept_ + logreg.coef_[0] * 2logodds
Out[34]:
array([ 0.64722323])
In [35]:
# convert log-odds to oddsodds = np.exp(logodds)odds
Out[35]:
array([ 1.91022919])
In [36]:
# convert odds to probabilityprob = odds/(1 + odds)prob
Out[36]:
array([ 0.65638445])
In [37]:
# compute predicted probability for al=2 using the predict_proba methodlogreg.predict_proba(2)[:, 1]
Out[37]:
array([ 0.65638445])
In [38]:
# examine the coefficient for alzip(feature_cols, logreg.coef_[0])
Out[38]:
[('al', 4.1804038614510901)]

Interpretation: A 1 unit increase in 'al' is associated with a 4.18 unit increase in the log-odds of 'household'.

In [39]:
# increasing al by 1 (so that al=3) increases the log-odds by 4.18logodds = 0.64722323 + 4.1804038614510901odds = np.exp(logodds)prob = odds/(1 + odds)prob
Out[39]:
0.99205808391674566
In [40]:
# compute predicted probability for al=3 using the predict_proba methodlogreg.predict_proba(3)[:, 1]
Out[40]:
array([ 0.99205808])

Bottom line: Positive coefficients increase the log-odds of the response (and thus increase the probability), and negative coefficients decrease the log-odds of the response (and thus decrease the probability).

In [41]:
# examine the interceptlogreg.intercept_
Out[41]:
array([-7.71358449])

Interpretation: For an 'al' value of 0, the log-odds of 'household' is -7.71.

In [42]:
# convert log-odds to probabilitylogodds = logreg.intercept_odds = np.exp(logodds)prob = odds/(1 + odds)prob
Out[42]:
array([ 0.00044652])

That makes sense from the plot above, because the probability of household=1 should be very low for such a low 'al' value.

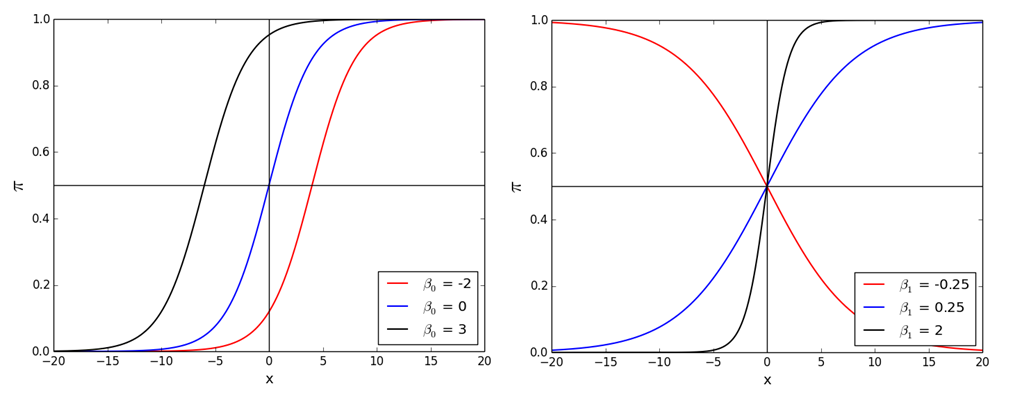
Logistic regression beta values

Changing the $\beta_0$ value shifts the curve horizontally, whereas changing the $\beta_1$ value changes the slope of the curve.

Part 7: Using Logistic Regression with Categorical Features

Logistic regression can still be used with categorical features. Let's see what that looks like:

In [43]:
# create a categorical featureglass['high_ba'] = np.where(glass.ba > 0.5, 1, 0)

Let's use Seaborn to draw the logistic curve:

In [44]:
# original (continuous) featuresns.lmplot(x='ba', y='household', data=glass, ci=None, logistic=True)
Out[44]:
<seaborn.axisgrid.FacetGrid at 0x1a16bda0>
In [45]:
# categorical featuresns.lmplot(x='high_ba', y='household', data=glass, ci=None, logistic=True)
Out[45]:
<seaborn.axisgrid.FacetGrid at 0x1b308e48>
In [46]:
# categorical feature, with jitter addedsns.lmplot(x='high_ba', y='household', data=glass, ci=None, logistic=True, x_jitter=0.05, y_jitter=0.05)
Out[46]:
<seaborn.axisgrid.FacetGrid at 0x1bc03710>
In [47]:
# fit a logistic regression modelfeature_cols = ['high_ba']X = glass[feature_cols]y = glass.householdlogreg.fit(X, y)
Out[47]:
LogisticRegression(C=1000000000.0, class_weight=None, dual=False,          fit_intercept=True, intercept_scaling=1, max_iter=100,          multi_class='ovr', penalty='l2', random_state=None,          solver='liblinear', tol=0.0001, verbose=0)
In [48]:
# examine the coefficient for high_bazip(feature_cols, logreg.coef_[0])
Out[48]:
[('high_ba', 4.4273153450187195)]

Interpretation: Having a high 'ba' value is associated with a 4.43 unit increase in the log-odds of 'household' (as compared to a low 'ba' value).

Part 8: Comparing Logistic Regression with Other Models

Advantages of logistic regression:

  • Highly interpretable (if you remember how)
  • Model training and prediction are fast
  • No tuning is required (excluding regularization)
  • Features don't need scaling
  • Can perform well with a small number of observations
  • Outputs well-calibrated predicted probabilities

Disadvantages of logistic regression:

  • Presumes a linear relationship between the features and the log-odds of the response
  • Performance is (generally) not competitive with the best supervised learning methods
  • Can't automatically learn feature interactions

This web site does not host notebooks, it only renders notebooks available on other websites.

Delivered by Fastly, Rendered by Rackspace

nbviewer GitHub repository.

nbviewer version: b280bae

notebook version: 4.1.0

nbconvert version: 4.1.0

Rendered 30 minutes ago

0 0
原创粉丝点击